

The CLL PROFILER Kit is intended to detect deletions of TP53, ATM and D13S319, and gains of the chromosome 12 centromere sequences in peripheral blood or bone marrow samples from patients with chronic lymphocytic leukaemia (CLL).
Probe specification
The P53 component consists of a 161kb probe, labelled in red that covers the whole P53 (TP53) gene and flanking regions. The ATM component consists of a 182kb probe, labelled in green that covers the telomeric end of the NPAT gene and the centromeric end of the ATM gene beyond the D11S3347 marker.
Probe information
The TP53 (tumor protein p53) gene at 17p13.1 is one of most important tumour suppressor genes; it acts as a potent transcription factor with fundamental role in the maintenance of genetic stability. Loss of TP53 is reported in 10% of patients with CLL, and is considered to be the poorest prognostic marker in that disease1,2. The ATM (ATM serine/threonine kinase) gene at 11q22.3 is an important checkpoint gene involved in the management of cell damage; its function is to assess the level of DNA damage in the cell and attempt repair by phosphorylating key substrates involved in the DNA damage response pathway3. Loss of ATM is reported in 18% of patients with CLL, and is considered a poor prognostic marker in that disease4. Analysis of the ATM/TP53 interaction in CLL has shown that TP53 and ATM play an important role in the proliferation of lymphoid cancer3. It has been shown that ATM enhances the phosphorylation of TP53, should the damage be so great that the cell requires destruction by apoptosis (which is mediated by TP53). Deletion of ATM removes this checkpoint activity and hence activation of TP53. Thus, there is no attempt made to repair, or apoptosis of, damaged cells, despite the presence of TP53. In the absence of ATM, damaged cells are allowed to continue to proliferate5.
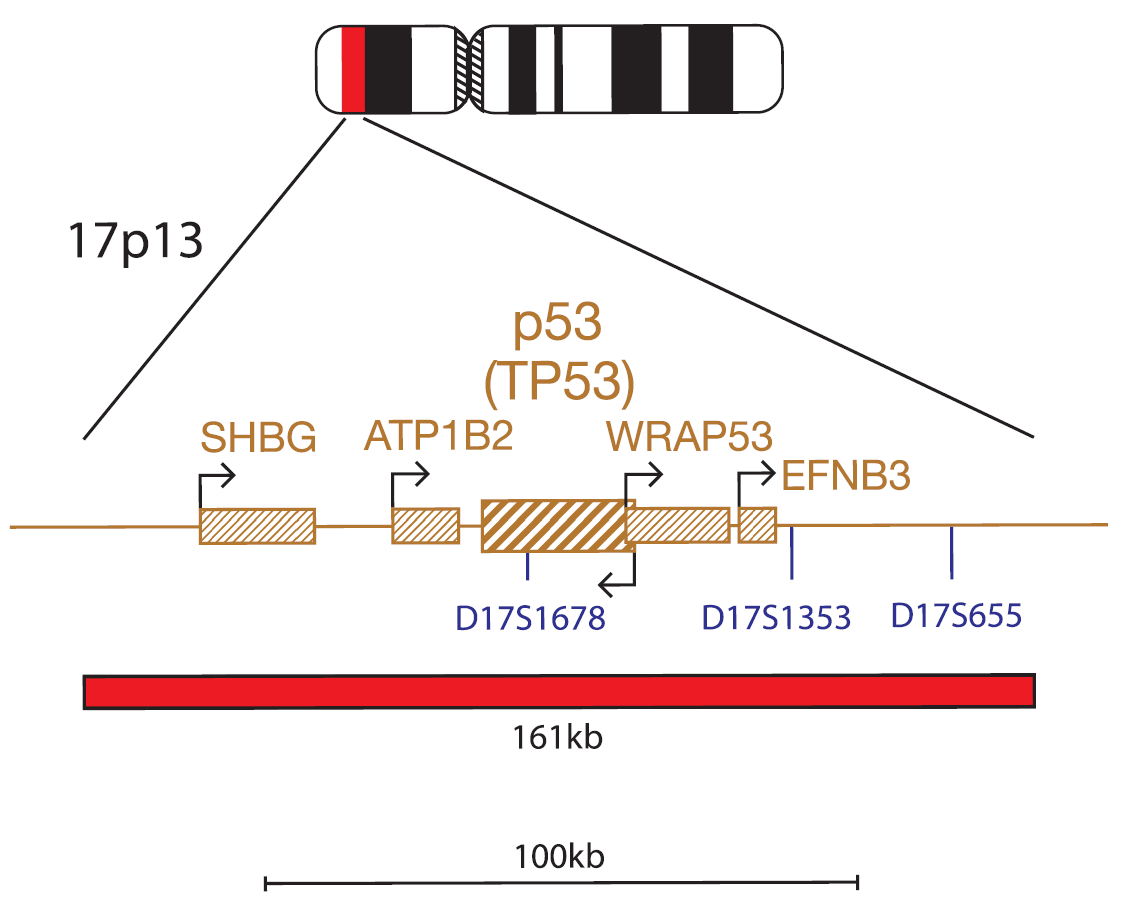
17p13.1 (P53)
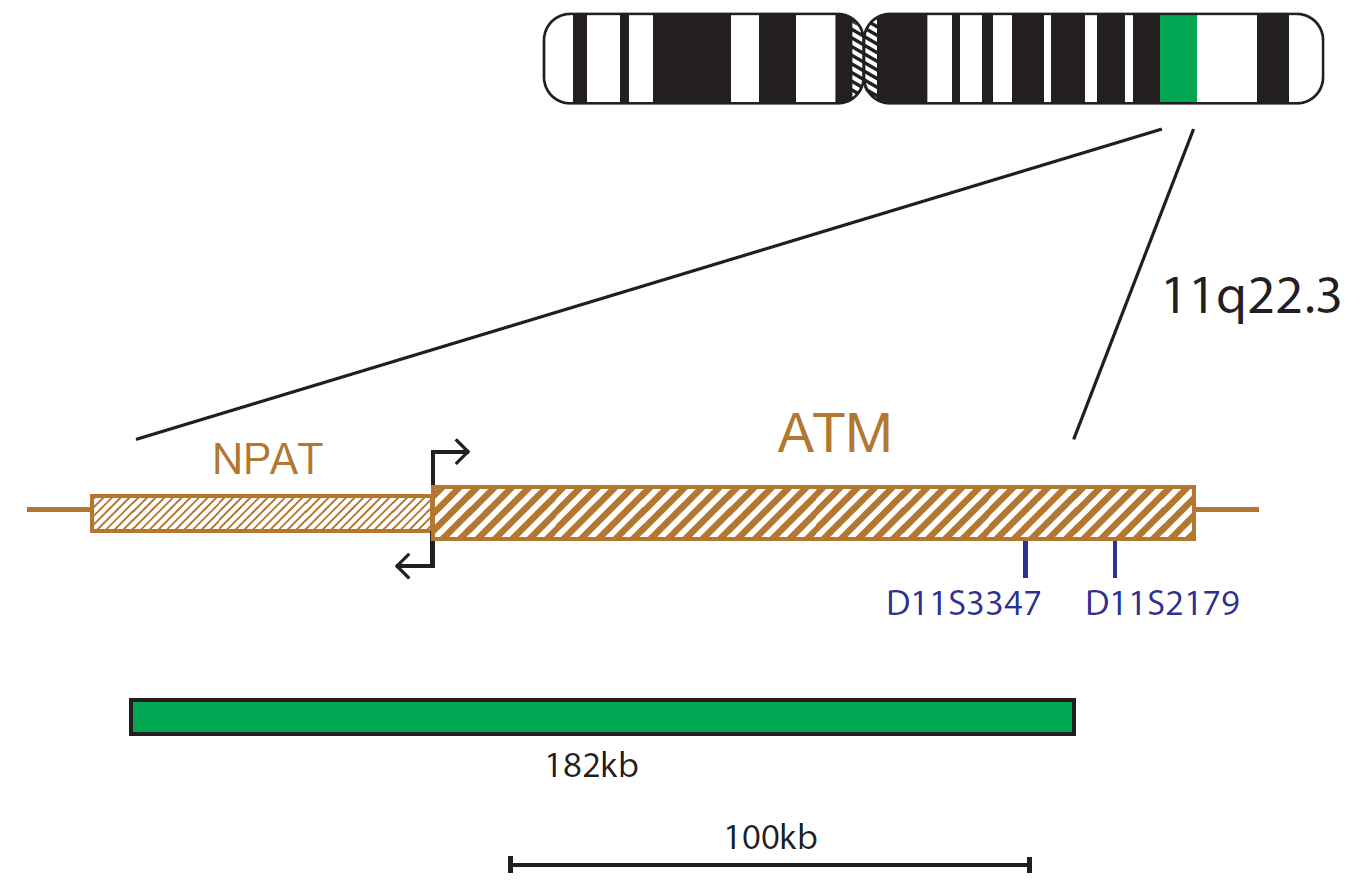
11q22.3 (ATM)
Probe specification
The Chromosome 12 Alpha Satellite Probe is labelled in green and recognises the centromeric repeat sequence D12Z3. The D13S319 probe consists of a 156kb probe, labelled in red that covers the centromeric end of DLEU1 and incorporates most of the DELU2 gene, it also covers the D13S319 and D13S272 markers. The 13qter subtelomere specific probe, labelled in blue, allows identification of chromosome 13 and acts as a control probe.
Probe information
Deletions affecting 13q14 are also the most frequent structural genetic aberrations in chronic lymphocytic leukaemia (CLL)6,7,8. This region is found to be heterozygously deleted in 30-60% and homozygously deleted in 10-20% of CLL patients9. The survival rate has been shown to be similar for the two groups10. Patients with 13q14 deletions are classified as very low risk, in the absence of any other genetic lesions1. Two non-coding RNA genes, DLEU1 (deleted in lymphocytic leukemia 1) and DLEU2 (deleted in lymphocytic leukemia 2), plus the genetic marker D13S319, span the pathogenic critical region of 13q1411. DLEU1 is considered to be the most likely CLL-associated candidate tumour suppressor gene within the 13q14 region12. Trisomy 12 is a recurrent abnormality in CLL, seen in 20% of the cases13 and often appears as the unique cytogenetic aberration (40-60% of cases with trisomy 12)7. Patients with trisomy 12 are classified as low-risk in the absence of any other genetic lesions1.
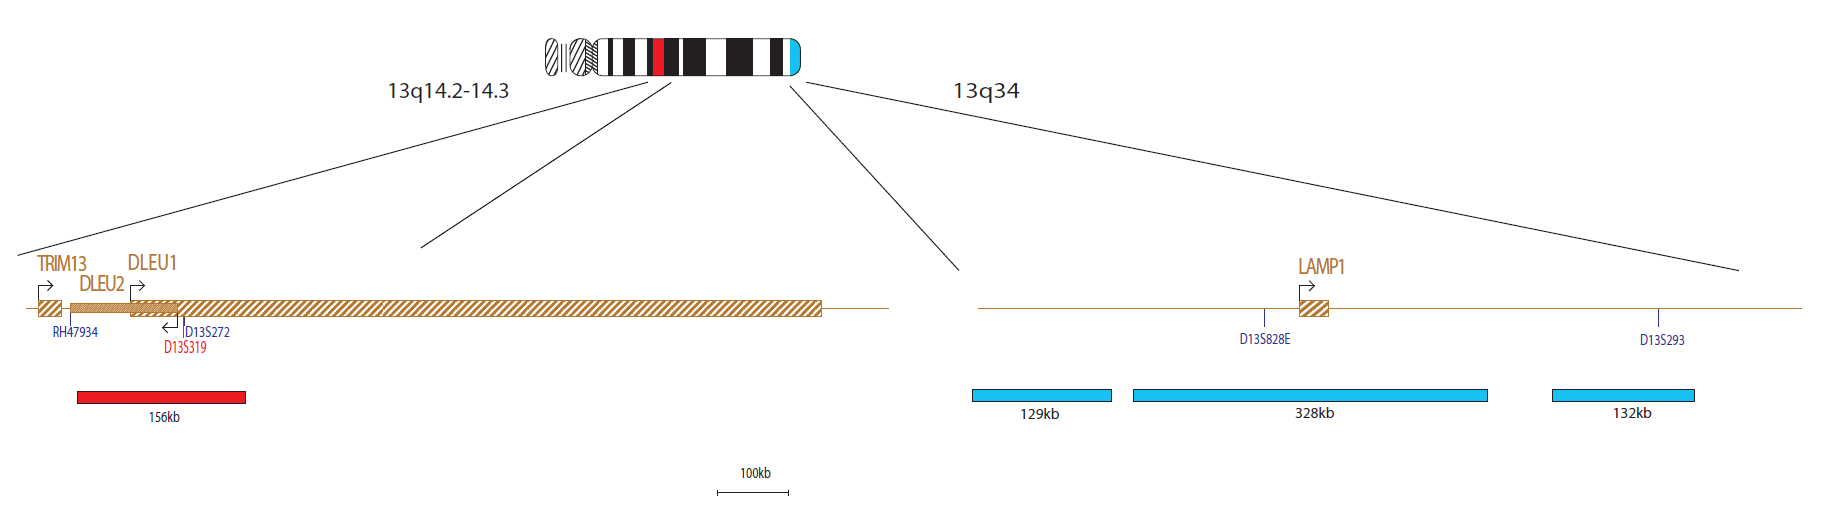
13q14.2-q14.3 (D13S319) / 13q34 (13qter)
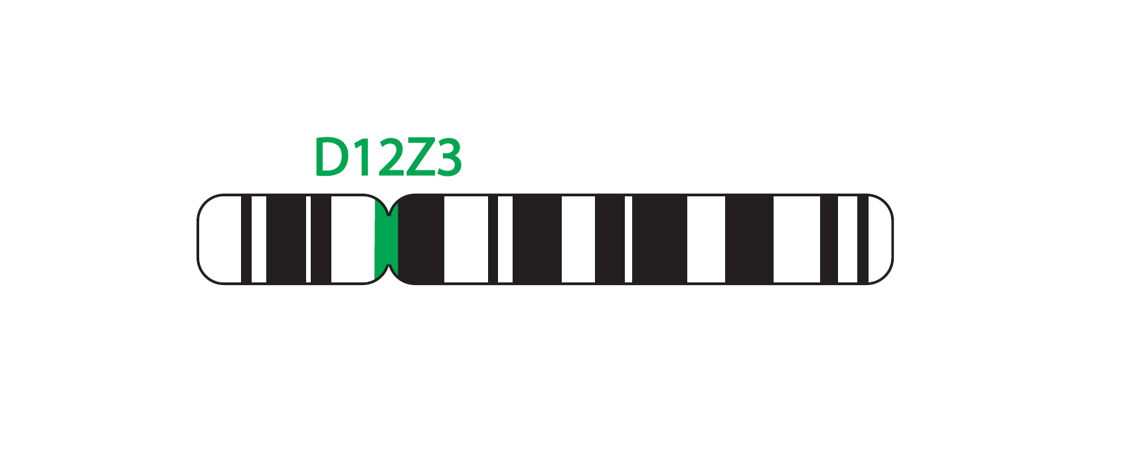
12p11.1-q11.1 (D12Z3)
Find certificate of analysis documentation for our CytoCell FISH probes

Our lab has been using a wide range of CytoCell FISH probes for a number of years, and have been increasing this range all the time. The probes have clear bright signals and show good reproducibility. CytoCell provides fast delivery of catalogue probes, and are very responsive when we have any queries or problems with their products.
Bridget Manasse
Addenbrookes Hospital, Cambridge University Hosiptals NHS Foundation Trust, UK
In our hands, CytoCell FISH probes have proven to be of the highest quality with bright, easy to interpret signals, thus providing confidence in our results. OGT's customer support is outstanding, as their staff are extremely knowledgeable and truly care about their customers and their customers’ needs.
Jennie Thurston
Director of Cytogenetics, Carolinas Pathology Group, USA
I first came across CytoCell FISH probes in a previous lab I worked in and I was struck by the quality of the products. Since this time, I have been recommending and introducing CytoCell probes across all application areas — now they are the primary FISH probes used in our lab. They have an excellent range of products and their ready-to-use reagent format saves considerable time.
Elizabeth Benner
Medical Technologist, University of Arizona Health Network, USA
We have been working with CytoCell fish probes for two decades because of their excellent clarity and intensity regardless of the size of the probe. It is so clear and simple to detect.
Dr. Marina Djurisic
Head of Laboratory of Medical Genetics, Mother and Child Health Care Institute of Serbia “Dr Vukan Cupic”, Serbia
The quality and consistency of CytoCell’s probes means I can trust the results, and my clients get their results in a timely manner.
Dr. Theresa C. Brown
Director, Cytogenetics Laboratory, Hayward Genetics Center, Tulane University School of Medicine, USA
It was very important for us to have more consistent results with our probes — easy-to-read bright signals and a range of vial sizes, which is much more cost-effective.
Janet Cowan, PhD
Director of the Cytogenetics Laboratory, Tufts Medical Center, USA
Not only do CytoCell offer an extensive range of high-quality FISH probes, the customer support is also excellent — providing fast access to all the probes I need. The probes are highly consistent with bright signals allowing easy scoring of results.
Dr. Eric Crawford
Senior Director, Genetics Associates Inc., USA
The quality and reproducibility of results using the CytoCell kit has been vital in accurately detecting co-deletions in our glioma investigations. We now have a cost-effective test that we can rely on that is also easy to use and interpret. We've been consistently impressed with this kit - not to mention the support offered by OGT's customer service, and have completely transitioned over to CytoCell probes.
Gavin Cuthbert, FRCPath
Head of Cancer Cytogenetics, Northern Genetics Servce, Newcastle, UK
 Visit USA site
 Visit Canada site


