
Kaajal Reevesa , Mafalda Bourbonb,c, Sandra Kachhiaa , Douglas Hurda , James Reida , Duarte Molhaa , Darren Hounieta and John Cousina
aOxford Gene Technology (OGT); bUnidade de I&D; cBioISI-Biosystems & Integrative Sciences Institute
The ability to determine Copy Number Variation (CNV) from short-read Next Generation Sequencing (NGS) data would enable laboratories to determine both CNV and Single Nucleotide Variation (SNV) simultaneously in one assay. To date, most NGS CNV analysis approaches have been designed for whole genome/exome sequencing and besides being less robust than standard array comparative genomic hybridisation (aCGH), they are not suitable for small targeted NGS panels.
In this study, we describe a method for detecting exonic CNVs using targeted NGS panels and a bioinformatics approach. This is demonstrated with the LDLR gene, involved in Familial Hypercholesterolaemia (FH) which is thought to have a prevalence between 1/500 and 1/2001 ; and the DMD gene on the X chromosome, involved in Duchenne muscular dystrophy (DMD) which has an estimated prevalence of 1/3500 of male births2.
In this study, samples underwent library preparation, short-read sequencing and bioinformatics analysis to determine intragenic CNV status. CNVs in samples were confirmed by aCGH.
Two sample cohorts were analysed in this project:
An overview of the library preparation and sequencing workflow is shown in Figure 1.
In brief, sheared DNA was amplified using the SureSeq™ NGS Library Preparation kit (OGT) and 500ng of each library was hybridised overnight to an OGT-developed panel of biotinylated oligonucleotides using the SeqCap EZ Hybridization and wash kit (Roche Nimblegen). The hybridised DNA fragments were captured to streptavidin beads, washed and subsequently amplified with the SureSeq NGS Library Preparation kit using indexing primers. A 4nM pool consisting of 24 individual DNA libraries was loaded into a v2 300 cycle Miseq cartridge (Illumina) and run on an Illumina Miseq.
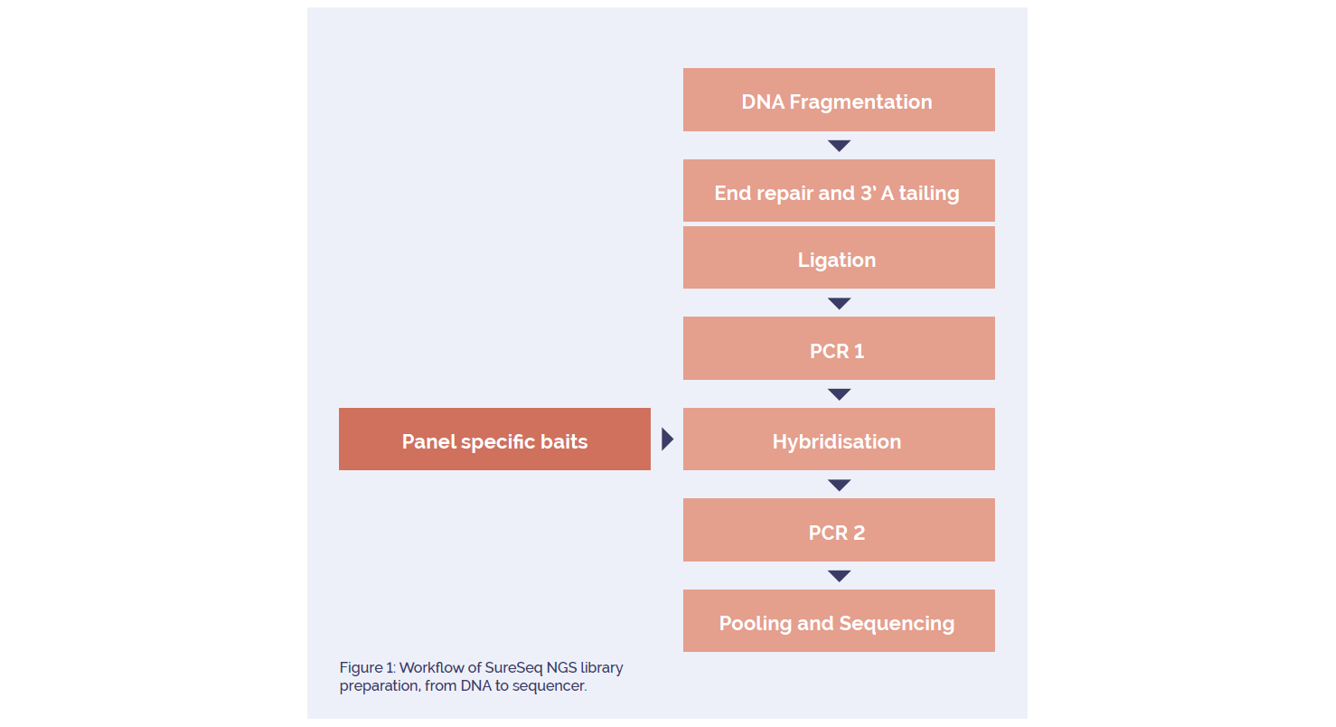
Figure 1: Workflow of SureSeq NGS library preparation, from DNA to sequencer.
A proprietary bait design approach is used in all OGT-developed panels to improve uniformity and depth of coverage across all target regions, important in accurately calling regions with CNVs. The two panel designs used in this experiment as are follows:
Sequence analysis including germline CNV detection was performed using OGT’s Interpret software (Hg 19 was used as the reference genome on IGV3 ) from FASTQ files obtained from the sequencer.
CNV detection algorithms used by Interpret were developed in-house by OGT, and use read-depth analysis with pre-determined parameters to determine copy-number status.
All samples determined by NGS analysis as containing CNVs were confirmed using aCGH.
High-resolution microarrays (OGT) were designed with high density of probes within the genes of interest. Samples were processed and labelled using the CytoSure® labelling kit (OGT), and analysis was performed using CytoSure Interpret software (OGT).
Uniformity of coverage is important in CNV calling from NGS and was high across all targets – examples shown in Figure 2.
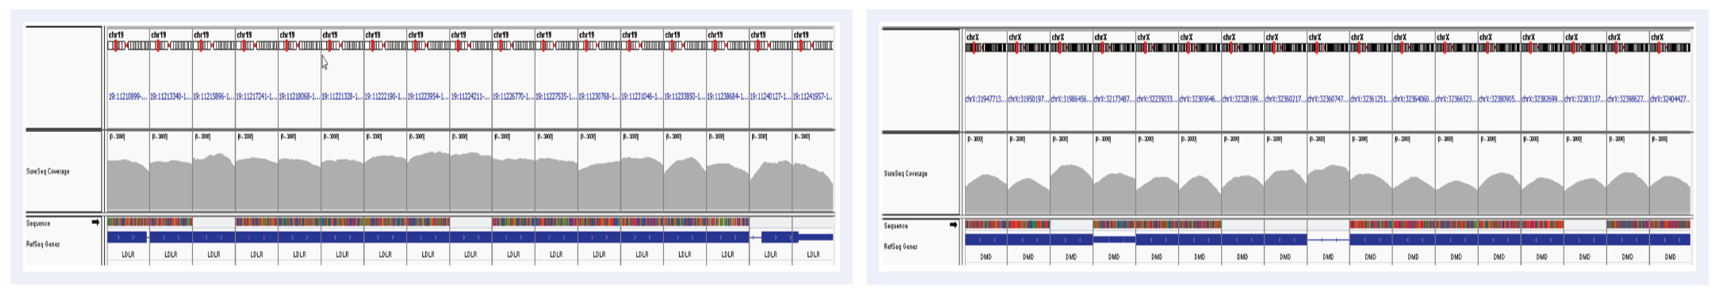
Figure 2: Uniformity of coverage in the LDLR gene (left) and part of the DMD gene (right) shown on IGV. Read depth across targets is indicated in grey.
Using the FH panel, 48 samples were processed in total, and the OGT algorithm correctly called CNVs in 5 samples. All of these CNVs were confirmed by the aCGH method. The remaining 43 samples were correctly called negative, concordant with previous MLPA assays.
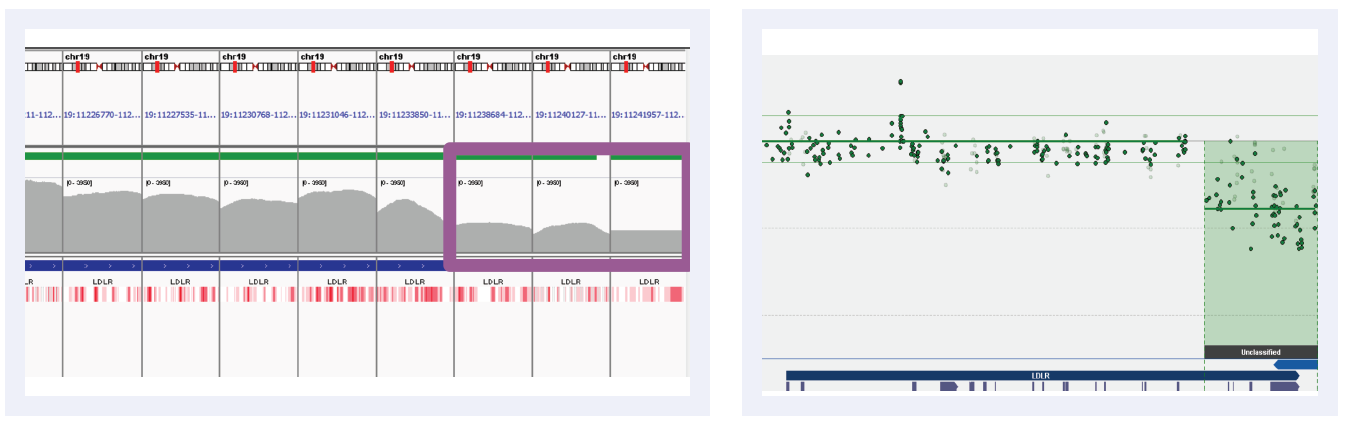
Figure 3A: Read depths across NGS targets as shown by IGV (left column) and concordant calls using microarray as shown by CytoSure Interpret (right column) for high-confidence deletions on LDLR across 5 separate samples (all heterozygous deletions). Purple boxes highlight regions where read depth is indicative of CNV.
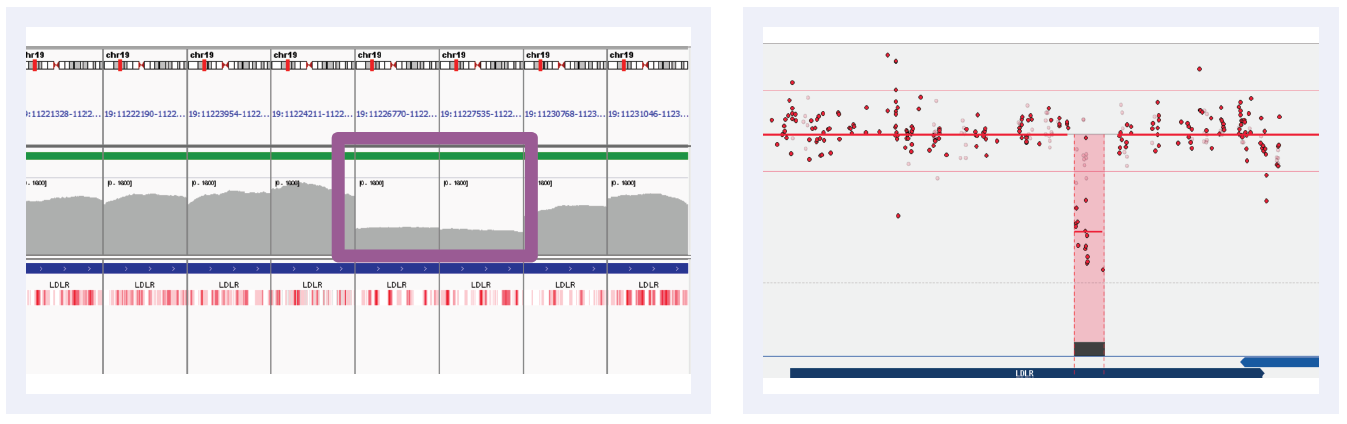
Figure 3B: Read depths across NGS targets as shown by IGV (left column) and concordant calls using microarray as shown by CytoSure Interpret (right column) for high-confidence deletions on LDLR across 5 separate samples (all heterozygous deletions). Purple boxes highlight regions where read depth is indicative of CNV.
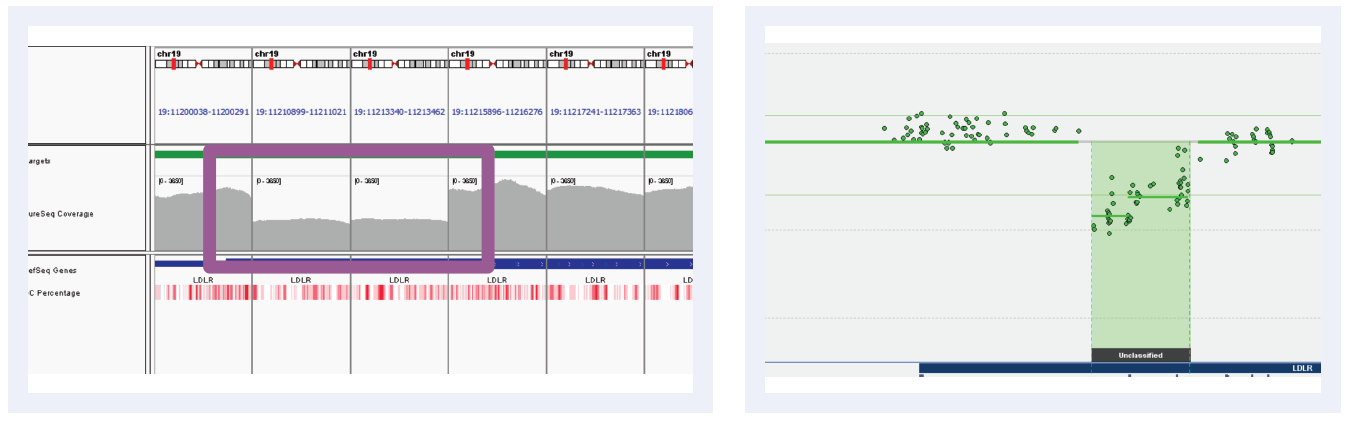
Figure 3C: Read depths across NGS targets as shown by IGV (left column) and concordant calls using microarray as shown by CytoSure Interpret (right column) for high-confidence deletions on LDLR across 5 separate samples (all heterozygous deletions). Purple boxes highlight regions where read depth is indicative of CNV.
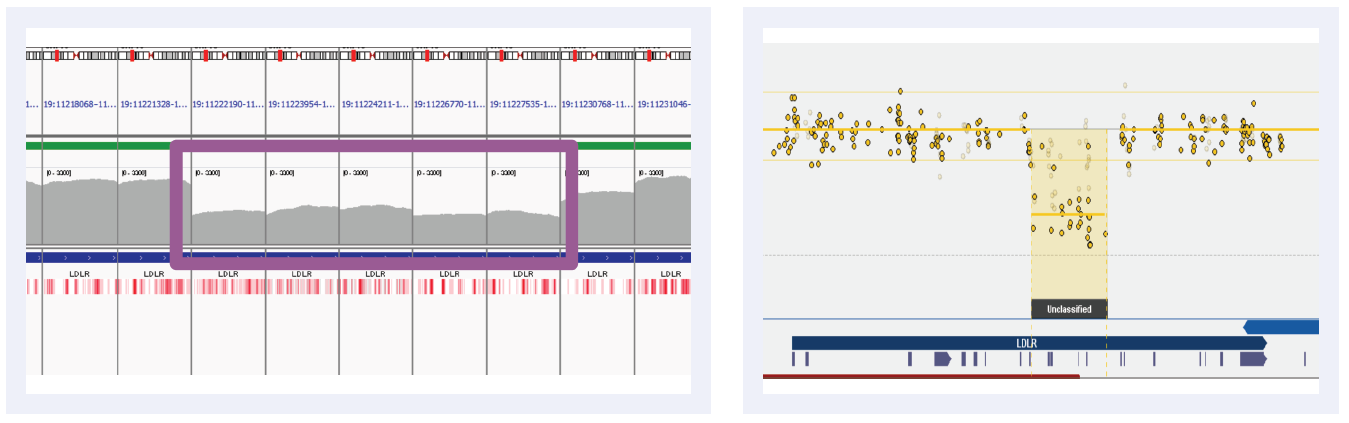
Figure 3D: Read depths across NGS targets as shown by IGV (left column) and concordant calls using microarray as shown by CytoSure Interpret (right column) for high-confidence deletions on LDLR across 5 separate samples (all heterozygous deletions). Purple boxes highlight regions where read depth is indicative of CNV.
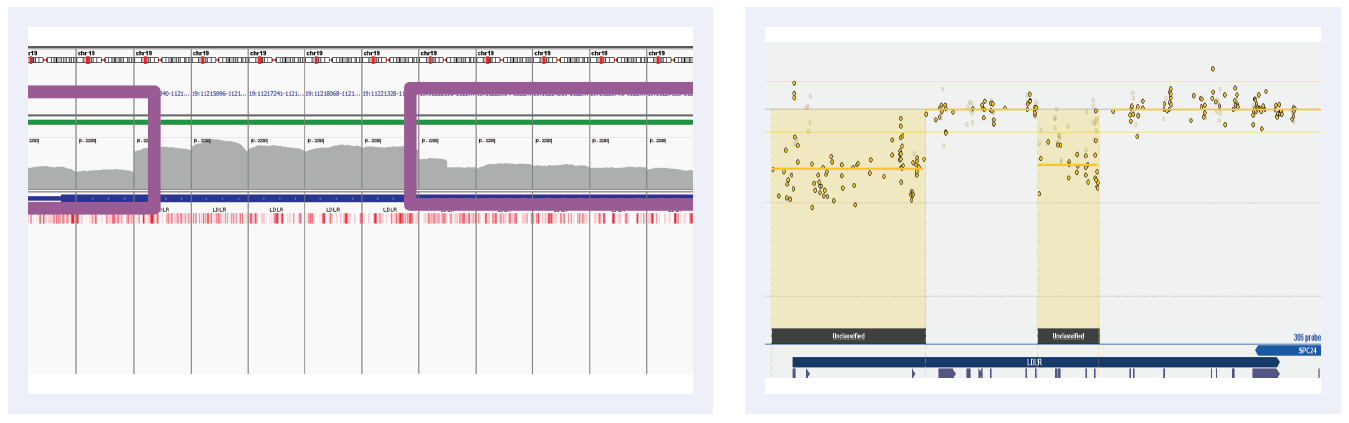
Figure 3E: Read depths across NGS targets as shown by IGV (left column) and concordant calls using microarray as shown by CytoSure Interpret (right column) for high-confidence deletions on LDLR across 5 separate samples (all heterozygous deletions). Purple boxes highlight regions where read depth is indicative of CNV.
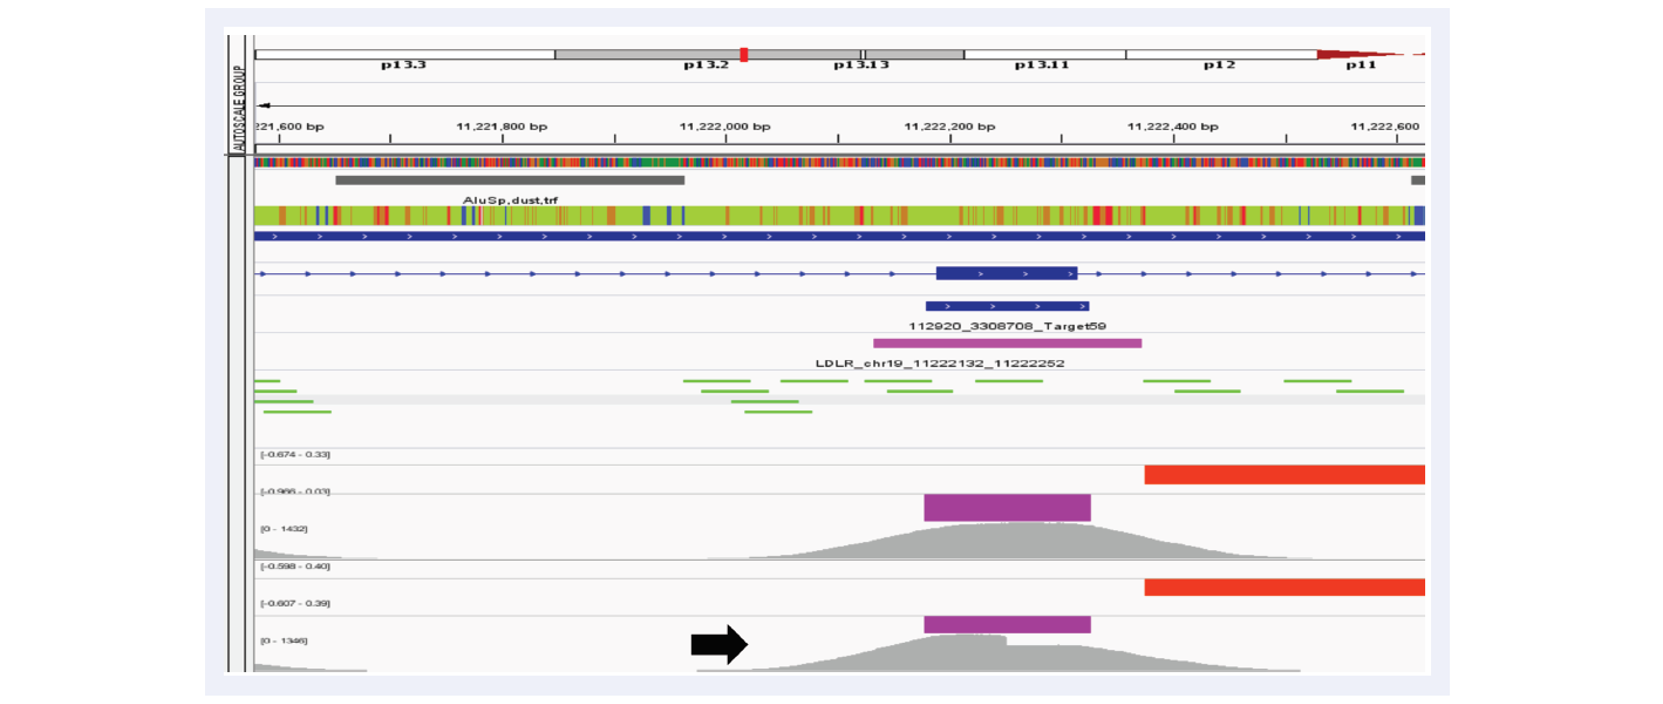
Figure 4: Example of a lower confidence call on LDLR due to a mid-exon breakpoint. Tracks as follows: aCGH probes used for confirmation (bright green lines), aCGH CNV calls (red), NGS CNV calls (purple). In one sample (black arrow), the aberration occurs mid-exon but is clearly visible and called by our algorithm. aCGH breakpoint detection occurs only over the next probe already within the CNV.
For processing samples with the DMD panel, analysis requires additional care to account for gender and X chromosome number. Breakpoints of CNVs are normally better resolved on aCGH due to coverage across intronic regions. However, within the 50 samples processed for this study, the OGT DMD panel successfully detected all affected exons overlapping the aberrations within the DMD gene, ranging from single exons to large genomic regions covering multiple exons. This was concordant with all CNVs described by the Coriell Institute for Medical Research.
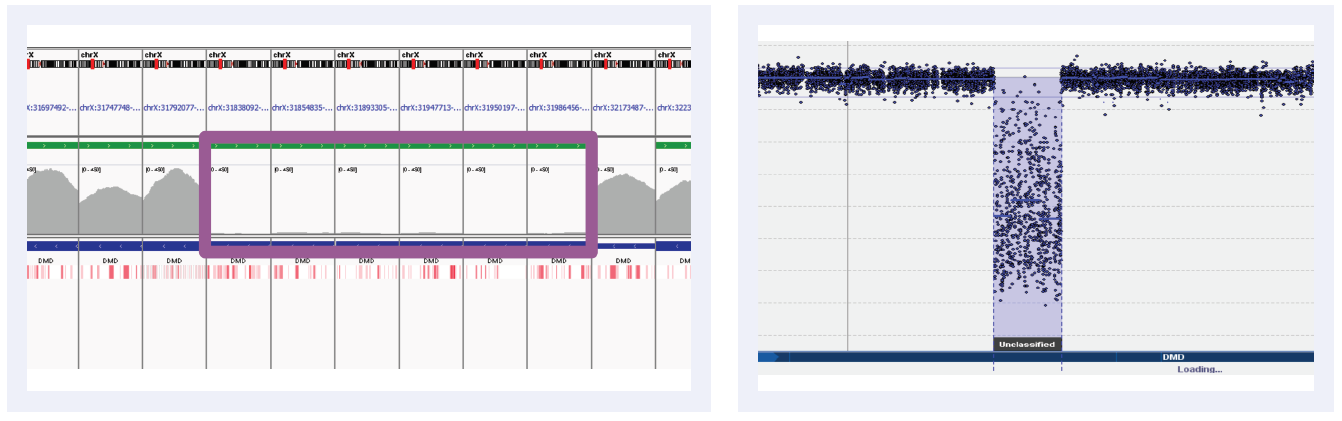
Figure 5A: Read depths across NGS targets as shown by IGV (left column) and concordant calls using microarray as shown by CytoSure Interpret (right column) for high-confidence CNVs on DMD across 6 separate samples. Purple boxes highlight regions where read depth is indicative of CNV.
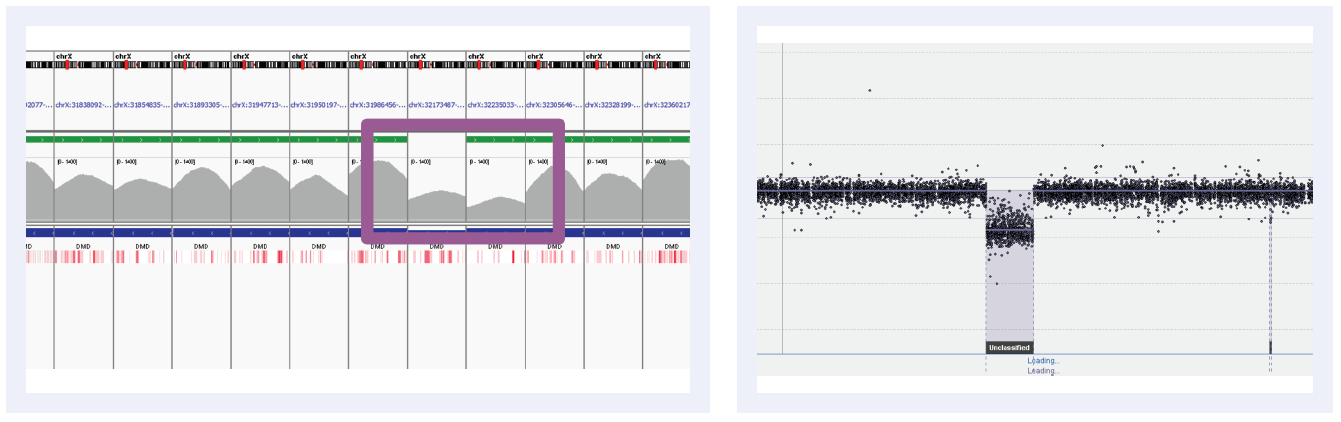
Figure 5B: Read depths across NGS targets as shown by IGV (left column) and concordant calls using microarray as shown by CytoSure Interpret (right column) for high-confidence CNVs on DMD across 6 separate samples. Purple boxes highlight regions where read depth is indicative of CNV.
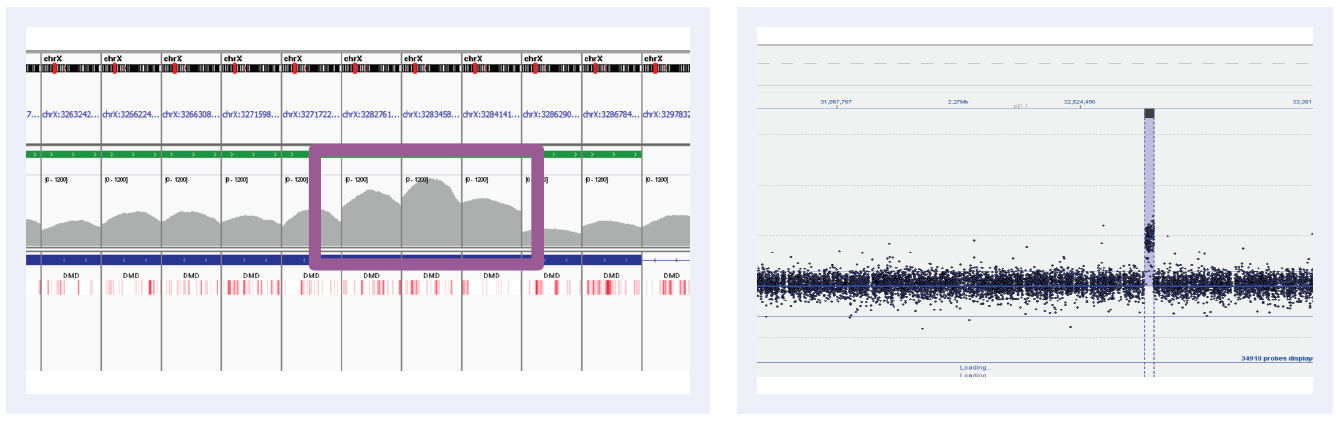
Figure 5C: Read depths across NGS targets as shown by IGV (left column) and concordant calls using microarray as shown by CytoSure Interpret (right column) for high-confidence CNVs on DMD across 6 separate samples. Purple boxes highlight regions where read depth is indicative of CNV.
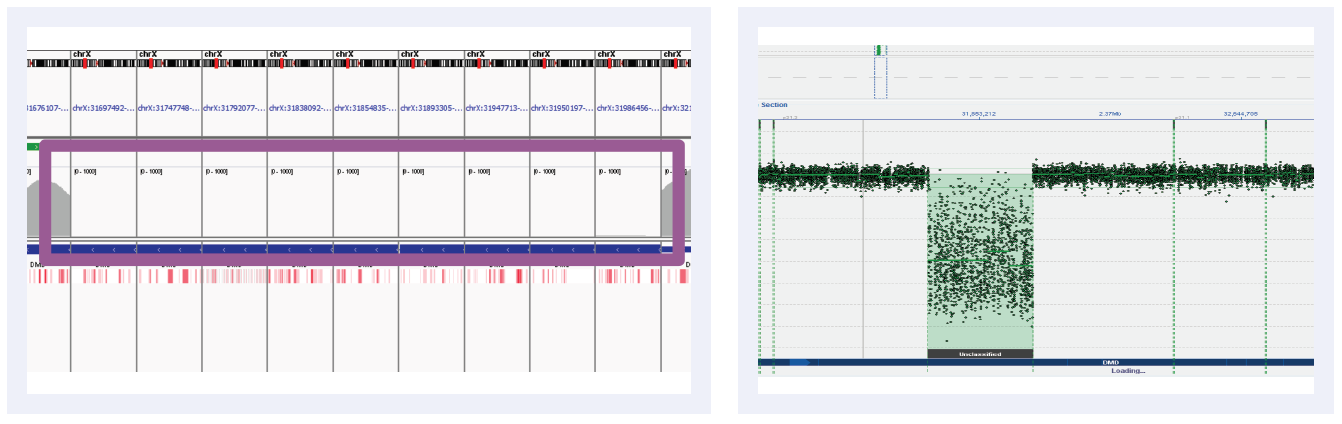
Figure 5D: Read depths across NGS targets as shown by IGV (left column) and concordant calls using microarray as shown by CytoSure Interpret (right column) for high-confidence CNVs on DMD across 6 separate samples. Purple boxes highlight regions where read depth is indicative of CNV.
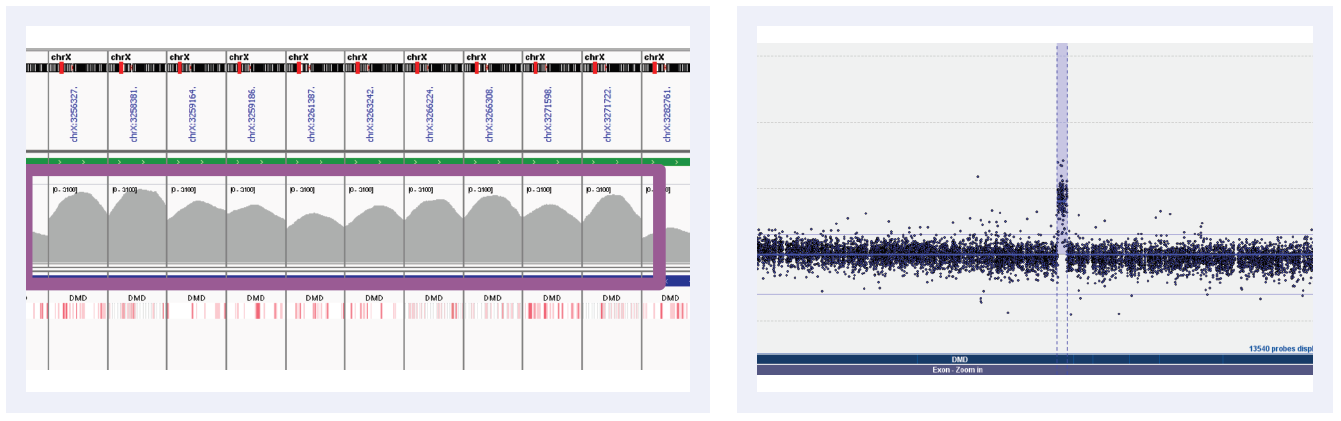
Figure 5E: Read depths across NGS targets as shown by IGV (left column) and concordant calls using microarray as shown by CytoSure Interpret (right column) for high-confidence CNVs on DMD across 6 separate samples. Purple boxes highlight regions where read depth is indicative of CNV.
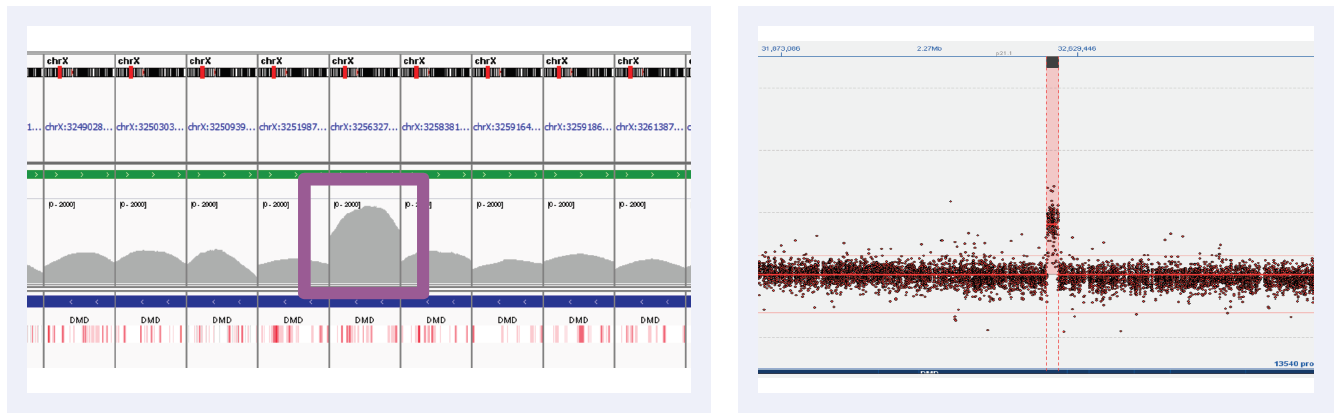
Figure 5F: Read depths across NGS targets as shown by IGV (left column) and concordant calls using microarray as shown by CytoSure Interpret (right column) for high-confidence CNVs on DMD across 6 separate samples. Purple boxes highlight regions where read depth is indicative of CNV.
Samples shown here are a spread of different types:
We have shown that intragenic CNVs can be detected using the OGT SureSeq NGS assay and confirmed with aCGH. The concordance was 100% over the targeted exons on the NGS panel against other techniques. These results indicate that a combined NGS and bioinformatics approach can be reliably used to determine CNVs in LDLR and DMD with potential for use in other applications.
CytoSure & SureSeq: For Research Use Only; Not for Diagnostic Procedures.
Call +44 (0)1865 856800 Email contact@ogt.com
Send us a message and we will get back to you
 Visit USA site
 Visit Canada site