
The preparation of formalin-fixed paraffin-embedded (FFPE) tissue for FISH testing can be challenging, due in particular to pre-analytic variables such as tissue fixation conditions and sample quality. Automated platforms offer an alternative to manual preparation for the de-paraffinization, pre-treatment and enzyme digestion of the FFPE slides prior to running the FISH protocol. Some high-throughput laboratories have reported improvements in the consistency and quality of FFPE tissue preparation when using such automation platforms.
With the rise of new biomarker discoveries and a greater understanding of the role that they play in personalised cancer therapies, many pathology testing services are experiencing a significant increase in sample throughput. As a result of this, and pressures to reduce costs, laboratories are considering automating their sample preparation for FISH.
Many laboratories prefer the flexibility to choose FISH probes from alternative suppliers rather than those provided by the instrument manufacturer. However, the biggest challenges when attempting to implement a new FISH probe into an automated workflow are the time and expense required to optimise each one.
In this application note, Dr. Jennie Thurston from Carolinas Pathology Group, North Carolina, USA, demonstrates the use of CytoCell® FISH probes with FFPE cell line samples prepared using the Abbott Molecular VP2000 Processor (50/60Hz CE IVD).
This study demonstrates that no further optimisation of the current laboratory FISH protocol or VP2000 workflow is required when using CytoCell FISH probes.

Dr. Jennie Thurston, Carolinas Pathology Group, North Carolina, USA
The CytoCell HER2 (ERBB2) Amplification probe (LPS 001-A), Chromosome 17 centromere probe (LPE 017GA), ALK Breakapart probe (LPS 019-A), ROS1-GOPC (FIG) Distal probe (LPS 511-A) and ROS1-GOPC (FIG) Proximal probe (LPS 510-A) were provided as part of this study.
To accurately assess the performance of the FISH probes, cell microarray (CMA) material (HistoCyte Laboratories www.histocyte.com) was used in the study to minimise the effect of tissue variability. The CMA blocks contain cell line cores that are 2mm in diameter and 3-3.5mm in length. The cell lines were fixed in 10% neutral buffered formalin and embedded in paraffin wax. The technical specifications of the CMA blocks used for this study are provided in Table 1.
For this study, each CMA block was cut into 3μm sections and mounted onto Superfrost® Plus positively charged slides. A total of 10 slides were cut from each block, which were then baked in an oven overnight at 50°C.
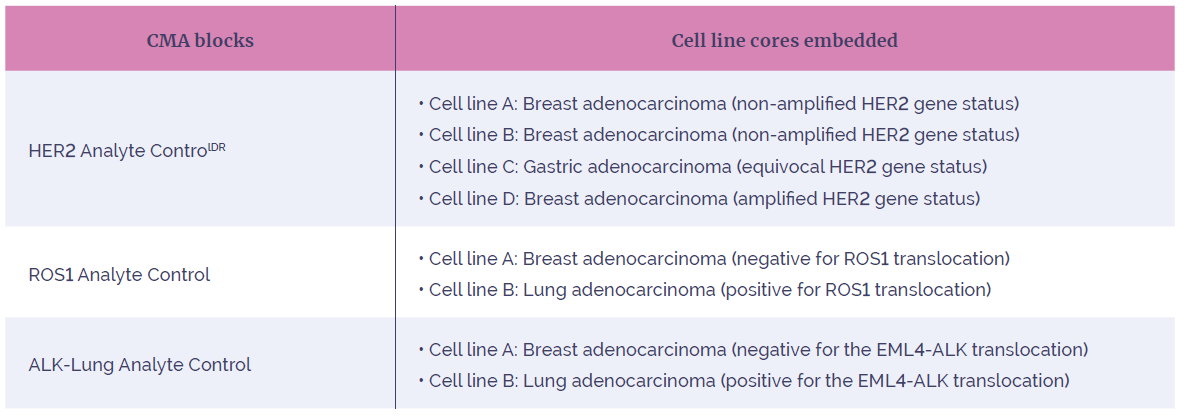
Table 1: Technical specification for the CMA blocks.
The slides were prepared using the VP2000 laboratory protocol (Fig.1). The VP2000 FFPE prepared slides were then hybridised using the laboratory’s standard FISH protocol (Fig.2). Each slide was interpreted by two analysts.
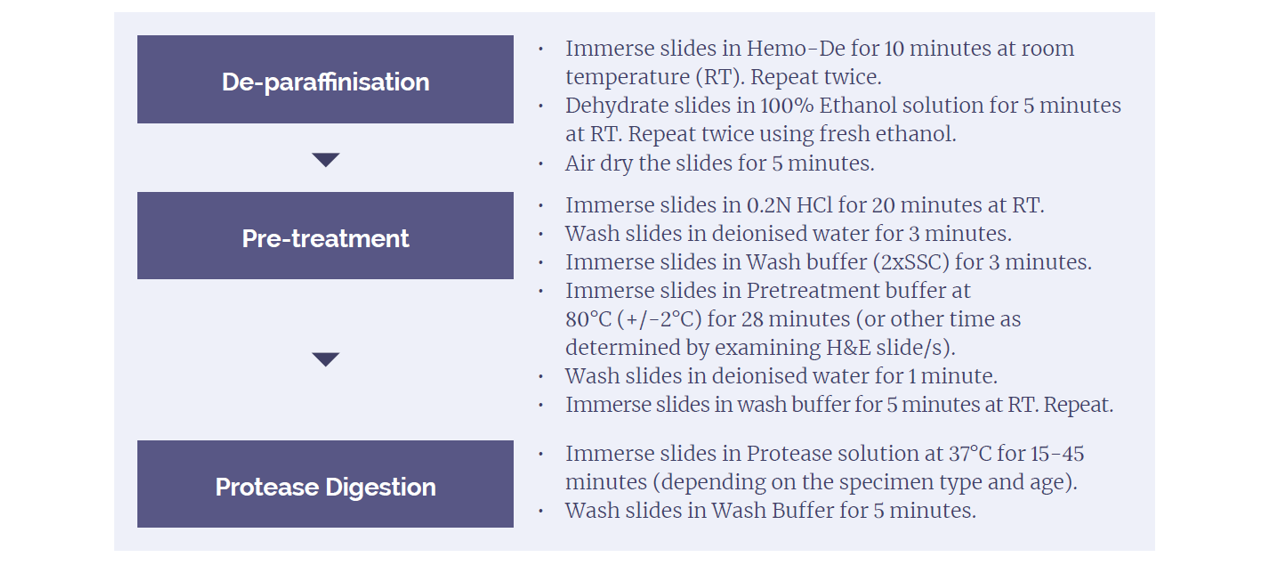
Figure 1: VP2000 Automated FFPE tissue processing protocol.
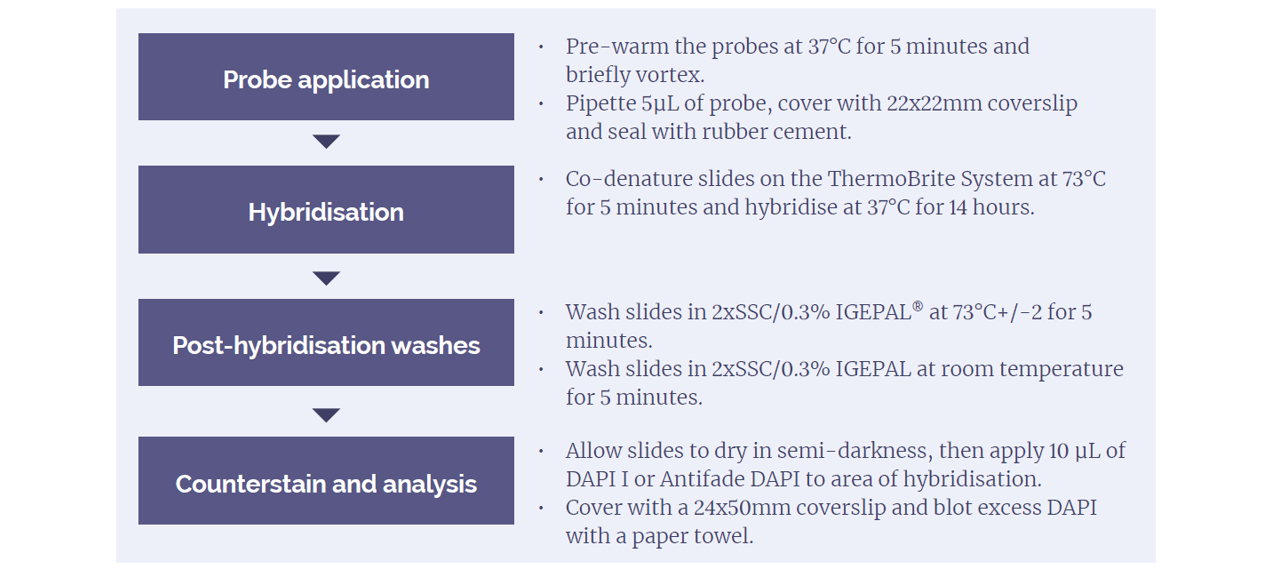
Figure 2: Carolinas Pathology Group FISH protocol.
The quality control (QC) acceptance criteria outlined in Table 2 and 3 below, were followed by the analysts. If the probes failed to meet the minimum acceptable probe signal strength (QC score = 2) and/or maximum level of acceptable background (QC score = 2), the slide was deemed as a fail.
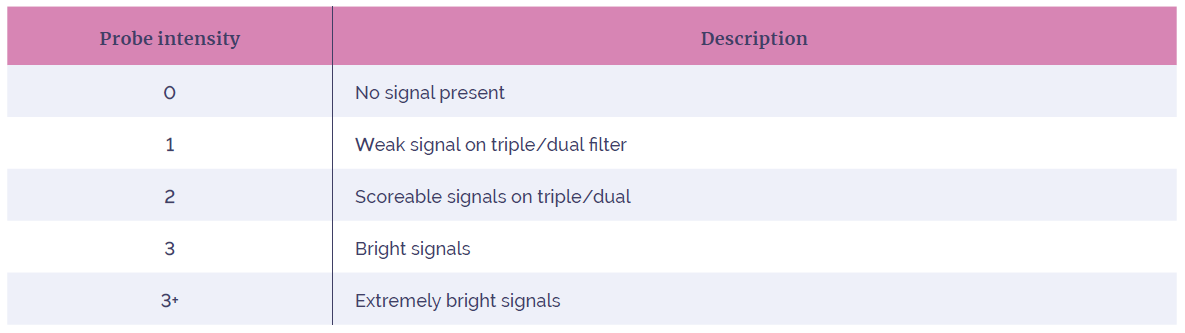
Table 2: Probe intensity acceptance criteria.
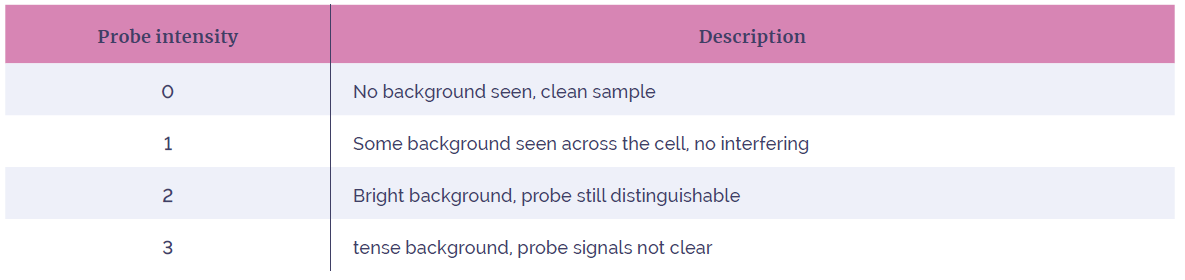
Table 3: Background intensity acceptance criteria.
A total of 100 cells per slide were analysed, with the percentage abnormal/normal cells documented. The HER2 slides were analysed in accordance with the current College of American Pathologist (CAP) guidelines for HER2 FISH analysis1. The ALK Breakapart probe (LPS 019-A), ROS1-GOPC (FIG) distal probe (LPS 511-A) and ROS1-GOPC (FIG) proximal probe (LPS 510-A) were analysed according to the AGT Cytogenetics analysis guidelines2.
All slides should demonstrate concordance when comparing the signal interpretation results with the reported results from the CMA supplier.
A selection of representative images that were analysed using FISH image capture software are shown in Fig.3 (HER2), Fig.4 (ROS1) and Fig.5 (ALK).
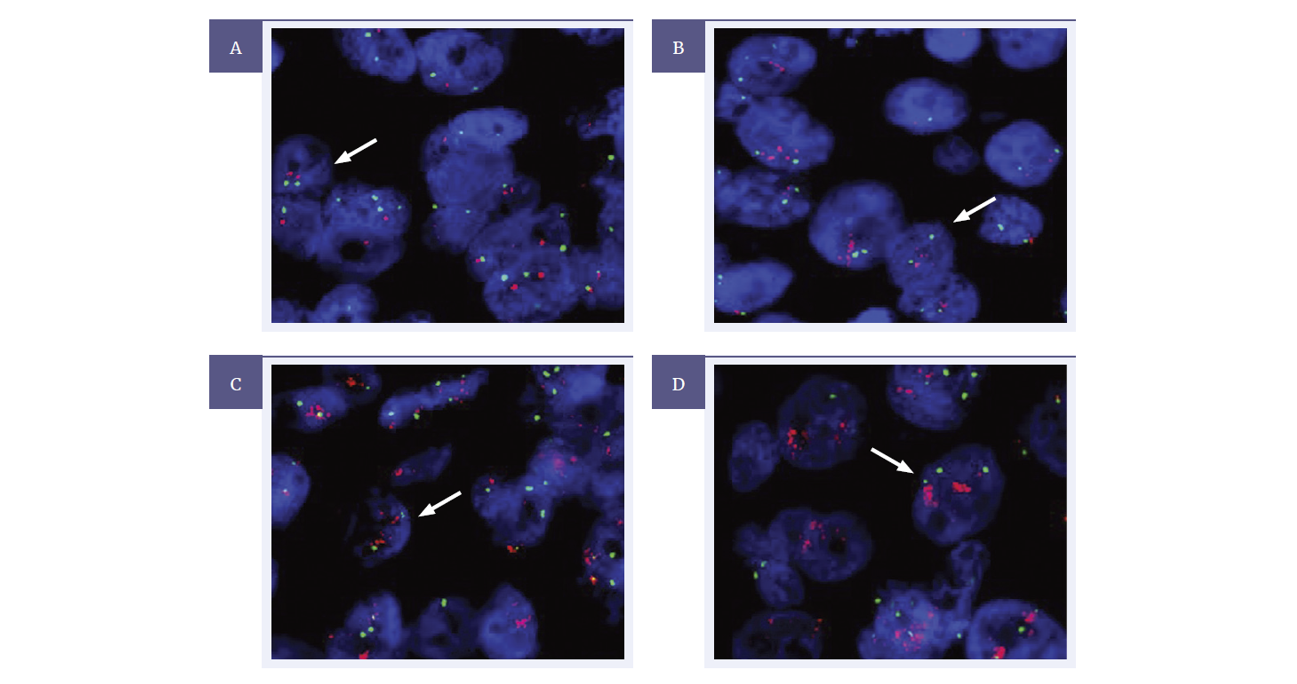
Figure 3: HER2 Analyte ControlDR tested using the CytoCell HER2 amplification probe (LPS 001-A) with Chromosome 17 centromere (LPE 017G).
Image A: Expected normal signal pattern of 2R 2G (1:1 HER2 to 17c ratio), representing non-amplified HER2 from cell line A.
Image B: An example of an equivocal HER2 (HER2 gene copy number 4.0-6.0 or FISH ratio =1.8-2.2), captured from cell line C.
Image C and D: Amplified HER2 (HER2 gene copy number >6.0 or FISH ratio >2.2), showing a high frequency of red probe signals, captured from cell line D.
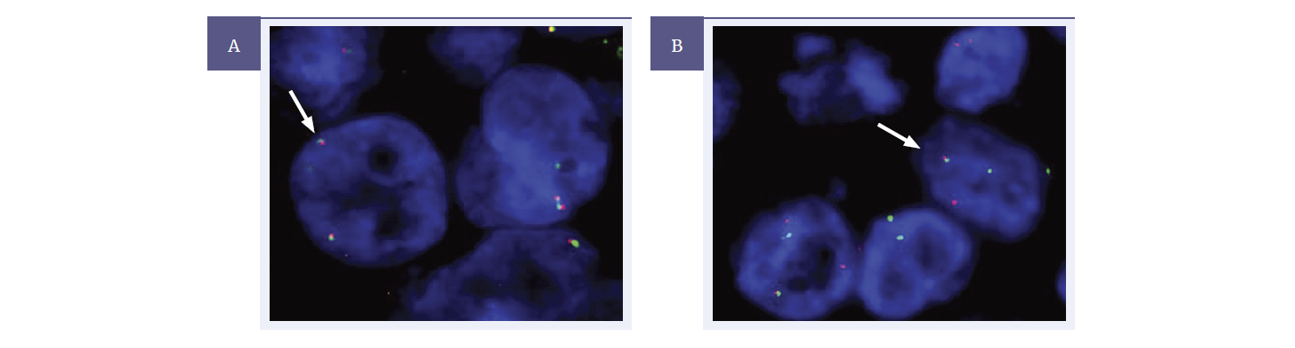
Figure 4: ROS1 Analyte Control slide was tested using the CytoCell ROS1-GOPC proximal and distal probes (LPH 0511-A/LPS 0510-A). In this study ROS1-GOPC proximal and ROS1-GOPC distal FISH probes were used to analyse the ROS1 gene.
Image A: Cell line A showing an expected normal signal pattern for ROS1 (not translocated).
Image B: Cells with a positive break (1R 1G 1F) for the ROS1 translocation. Signal pattern heterogeneity was also noted due to the nature of the cell line material used.
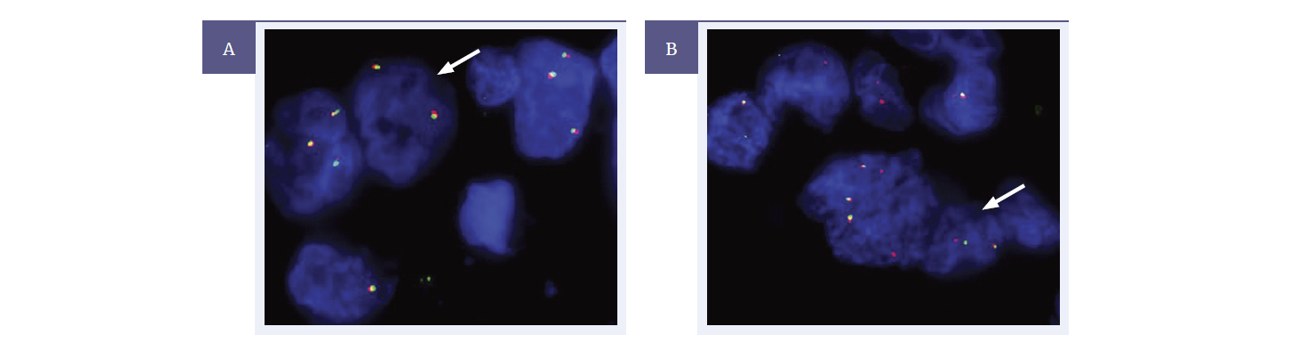
Figure 5: ALK-Lung Analyte Control tested using the CytoCell ALK breakapart probe (LPS 019-A).
Image A: Represents the expected normal signal pattern for ALK (2 fusion signals) observed in cell line A.
Image B: Shows a cell with a positive break (1R 1G 1F) for an ALK rearrangement.
All slides were assessed and assigned a QC score based on FISH probe signal intensity and level of cellular background observed.
Every slide met the acceptance criteria, with very bright probe signals with minimal/acceptable level of background observed, with the exception of one slide from the ALK Lung analyte control that produced a background intensity score of 3. Although this did not meet the acceptance criteria for this study, an overall signal interpretation could still be obtained from this slide.
Average scores taken from all 10 slides per CMA block analysed.
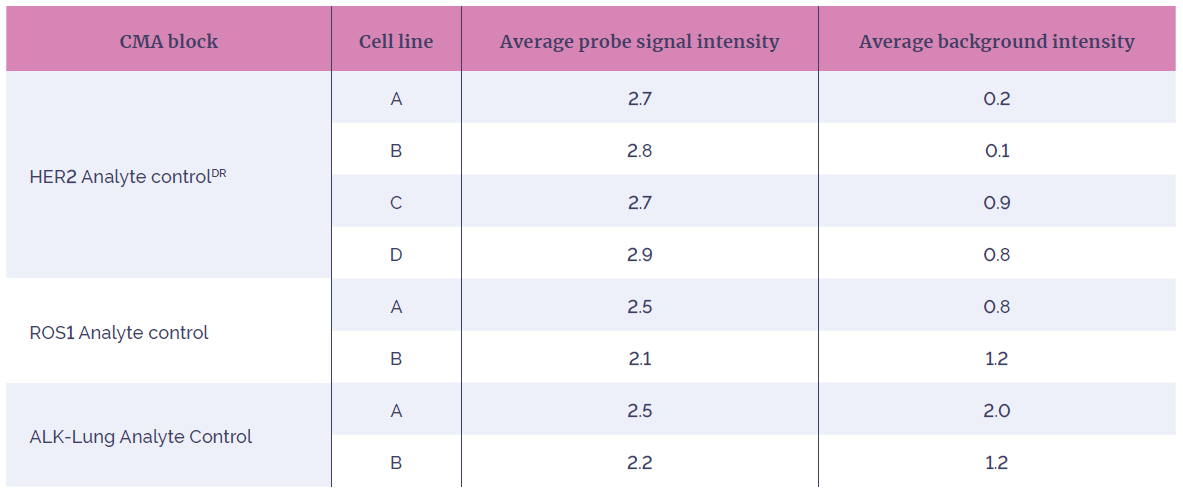
Table 4: Quality control results.
A total of 1000 cells were analysed per CMA block (100 cells per slide). The results were interpreted by two analysts. All slides produced concordant results between the two analysts and no third analyst review was required.
All slides demonstrated 100% concordance. The concordance of these results was determined by comparing the signal patterns interpreted by the analyst against the FISH verification results provided by the CMA supplier.
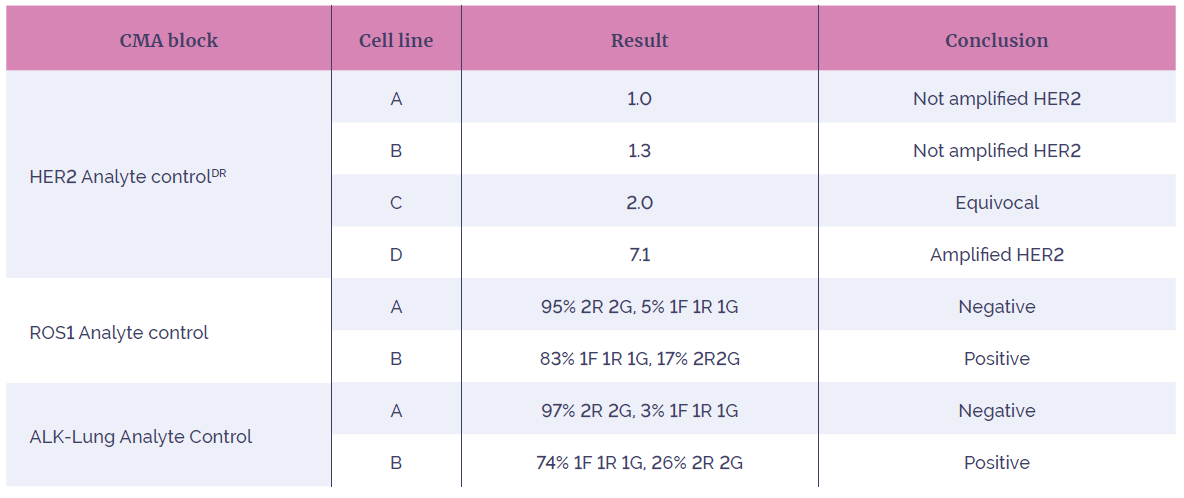
Table 5: Clinical interpretation results.
The results of this study show that Carolinas Pathology Group were able to implement the CytoCell HER2 (ERBB2) Amplification probe (LPS 001-A), Chromosome 17 centromere probe (LPE 017G-A), ALK Breakapart probe (LPS 019-A), ROS1-GOPC (FIG) distal probe (LPS 511-A) and ROS1-GOPC (FIG) proximal probe (LPS 510-A) into their automated VP2000 FFPE tissue processing workflow, without any significant amendments or changes to their existing workflow.
The automated VP2000 FFPE tissue processing protocol used with the CytoCell HER2, ALK and ROS1 FISH probes produced excellent results meeting the defined acceptance criteria on breast, gastric and lung cell line material. The CytoCell FISH probes produced high intensity probe signals with minimal/no background in the standard pre-treatment and enzyme digestion conditions used by the laboratory, no optimisation was required.
All cell lines use in this study demonstrated 100% concordance against the reported results.
Laboratories must undertake all appropriate validation of any LDT as per 42 CFR 493.1253 - Standard: Establishment and verification of performance specifications.
The tests discussed in this report were developed and their performance characteristics determined by the Parke Cytogenetics Laboratory at Atrium Health. They have not been cleared or approved by the U.S. Food and Drug Administration.
IGEPAL® is a registered trademark of Rhodia Operations. Hemo-De™ is a trademark of Scientific Safety Solvents. SuperFrost® is a trademark of Fisher Scientific and its subsidiaries. CytoCell® (Cytocell Ltd). Product availability may vary from country to country and is subject to varying regulatory requirements. Please contact your local representative for availability.
Call +44 (0)1865 856800 Email contact@ogt.com
Send us a message and we will get back to you
 Visit USA site
 Visit Canada site