
James Reid, Venu Pullabhatla, Laura Parkes, John Shovelton, Ezam Uddin, Lyudmila Georgieva, Aysel Heckel, Jolyon Holdstock, Graham Speight
Next-Generation Sequencing (NGS) has enabled large-scale identification of variants with increased reliability and accuracy. This is crucial for detecting low-frequency variants for cancer research.
At OGT, we have developed Interpret, as a partner software tool to our SureSeq™ NGS panels, to facilitate data analysis in an easy, user-friendly way. Interpret has been benchmarked with known and validated variants from control reference standards achieving high concordance.
A custom SureSeq myPanel™ NGS panel was designed to detect variants from the OncoSpan and Tru-Q7 commercial reference standards (Horizon Discovery, Cambridge, UK). These two references contain 55 and 33 variants belonging to 17 and 13 genes respectively (Table 1). Both contain SNVs and indels with known variant allele frequencies (VAF) validated by digital real-time PCR. The OncoSpan standard contains common variants spanning low to high VAFs (1-97%) whereas the Tru-Q7 standard contains rare variants with very low frequencies (1% and 1.3%). Samples were processed in triplicate at starting inputs of 100, 250 and 500 ng.
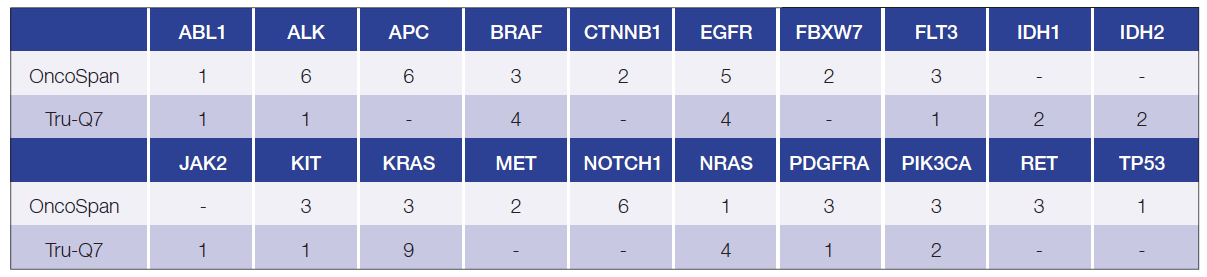
Table 1: Total number of validated variants assessed per gene and standard.
Sample sequencing was performed using the standard OGT protocol for target enrichment on an Illumina MiSeq™. FASTQ files were uploaded to Interpret and analyzed using a default low-frequency somatic analysis protocol (≥1% VAF threshold) throughout and a lower one at 0.1% for comparing the observed VAFs in the Tru-Q7 standard.
Data was evaluated by comparing the observed allele frequencies with the expected results for each variant; linear regression fit was used for the Oncospan and inter-quantile range limits for the Tru-Q7. Reproducibility of the panel was calculated using the coefficient of variation (CV) between triplicate samples at each starting input amount. Accuracy was assessed using sensitivity and specificity.
Both standards showed very good results in terms of observed versus expected VAFs. In the Oncospan standard samples, the observed allele frequencies matched the expected ones very closely with an R2 value of 0.978 (Figure 1a). Similarly, in the Tru-Q7 dataset, the interquartile range of the observed frequencies of all variants ranged from 0.89 to 1.44. When variants were grouped by gene, no clear differences emerged and the median value for each gene ranged from 0.94 to 1.51 (Figure 1b). In terms of accuracy, the observed sensitivity and specificity scores were very high in both panels when using the default somatic protocol (Table 2).
Examples of reproducibility and detection robustness of the panels are highlighted in the read alignment views of an indel and an SNV in three replicate samples, all showing consistent variant allele frequencies (Figures 2a and 2b). The overall reproducibility of these results was confirmed by the low CVs observed across the different amounts of starting materials.
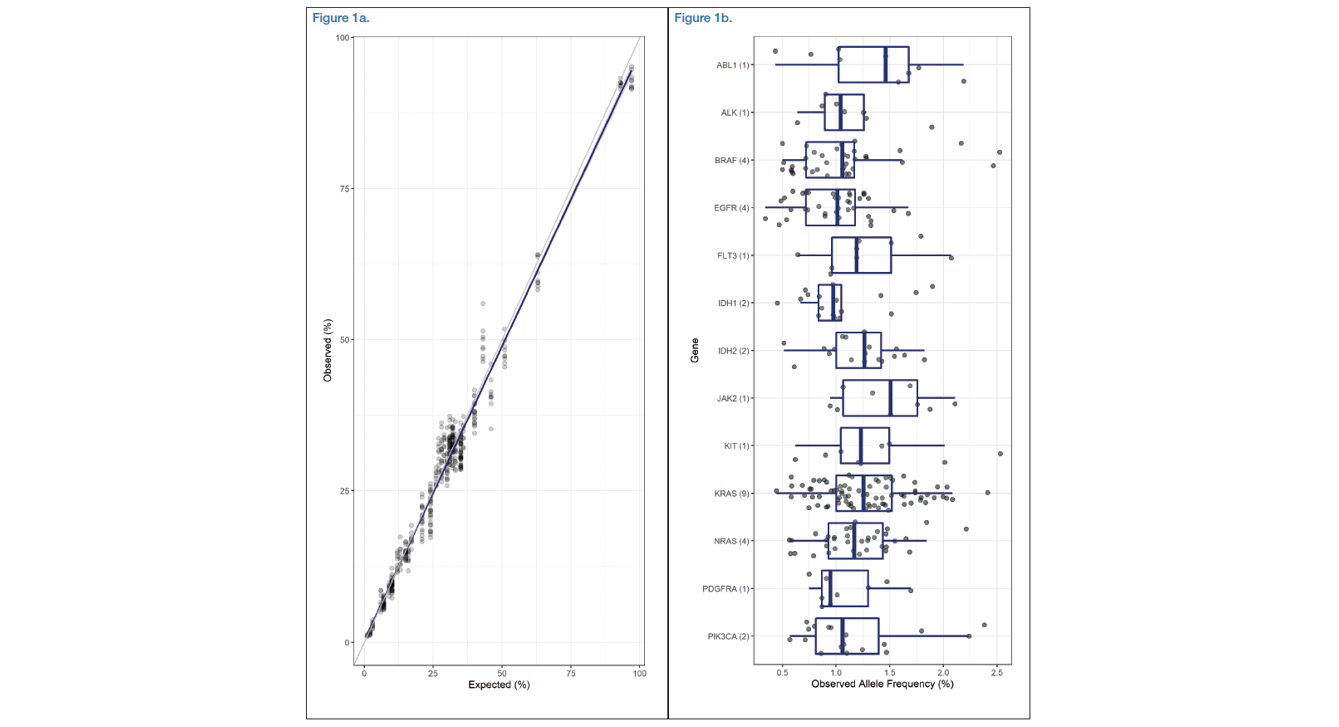
Figure 1a: Oncospan - Scatterplot of expected and observed alternative allele frequencies of 55 variants in 17 genes with observed frequencies above 1% (489/495), each was performed in triplicate with three different starting materials. A linear regression fit (blue line) and 95% confidence interval (grey area) was applied to the data.
Figure 1b: Tru-Q7 - Boxplots including overlaid points displaying the observed allele frequencies of 33 variants in 13 genes all with expected frequencies of 1 or 1.3% (291/294). The number in brackets behind the gene name represents the number of variants tested in that gene.
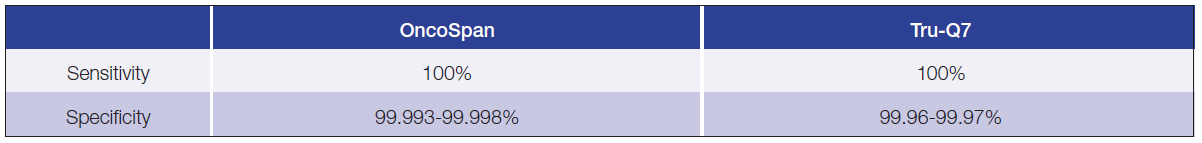
Table 2: Accuracy measures for both panels obtained by averaging the results for variants observed above 1% over the technical replicates and the starting material. Sensitivity = TP/TP+FN, Specificity = TN/TN+FP.
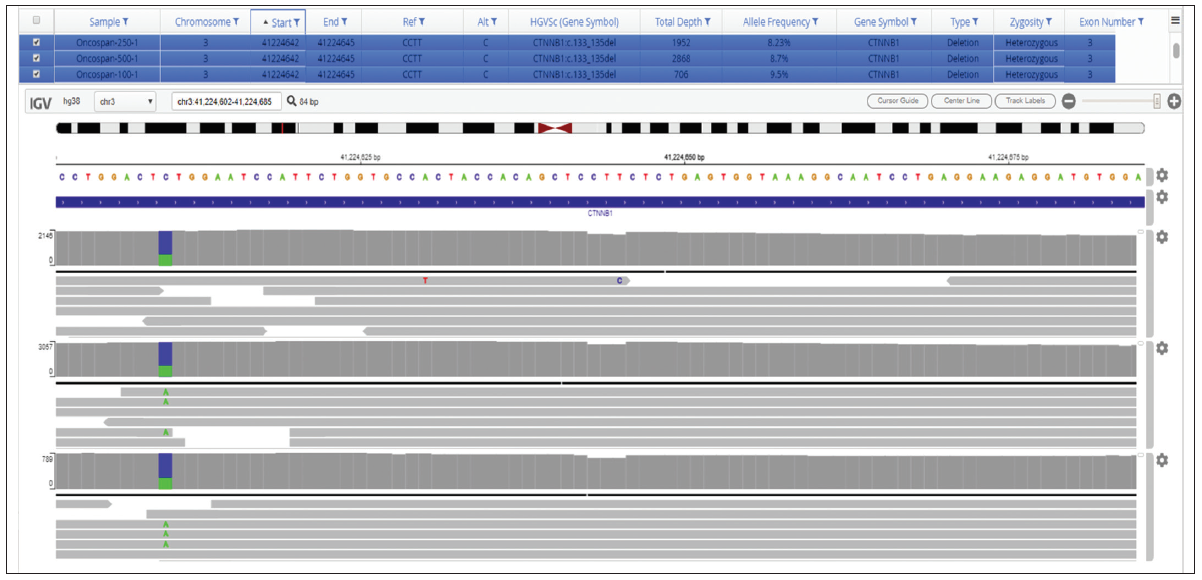
Figure 2A: Read alignment view from SureSeq Interpret of an indel in CTNNB1 in three replicate samples..
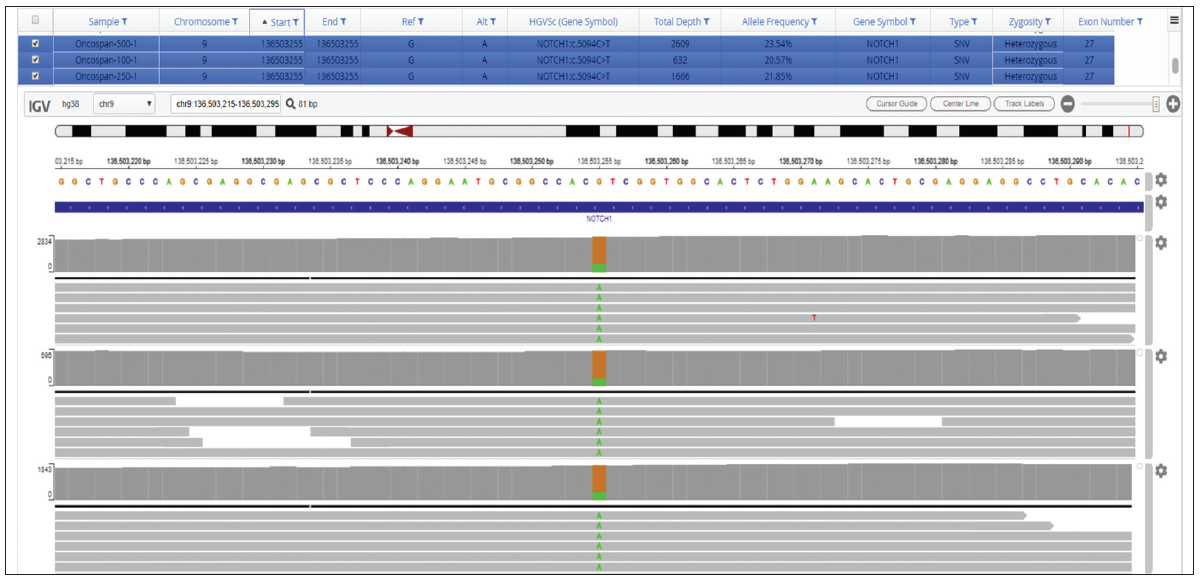
Figure 2B: Read alignment view from SureSeq Interpret of an SNV in NOTCH1 in three replicate samples.
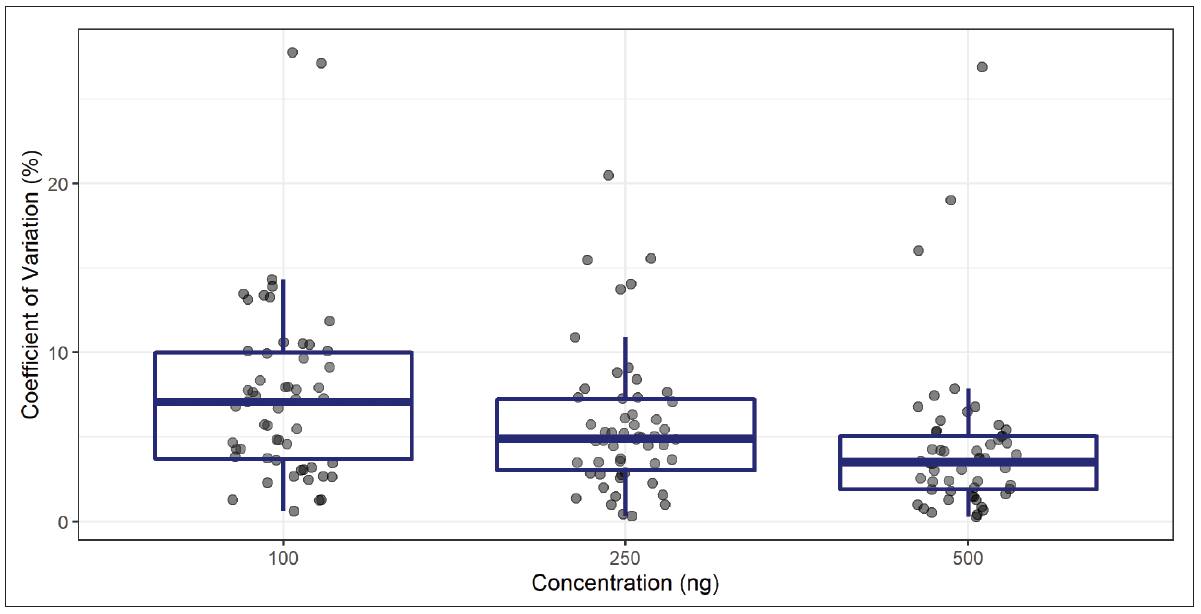
Figure 2C: Boxplots and overlaid points displaying the coefficient of variation for each variant according to each concentration in the OncoSpan samples.
OGT’s Interpret software showed robust and reproducible results in the detection of low-frequency variants using reference standards. Used in conjunction with OGT’s SureSeq NGS panels this complimentary software tool facilitates the accurate analysis and visualization of a wide range of variant types at low-frequency with high confidence.
SureSeq: For Research Use Only; Not for Diagnostic Procedures.
Call +44 (0)1865 856800 Email contact@ogt.com
Send us a message and we will get back to you
 Visit International site
 Visit USA site