
Graham Speight, Giulia Poloni, Natalie Milner, Venu Pullabhatla, James Reid, Jolyon Holdstock, Lyudmila Georgieva (Oxford Gene Technology)
Chronic lymphocytic leukemia (CLL) is a chronic lymphoproliferative disorder characterized by monoclonal B cell proliferation. It is the most common adult leukemia in Western populations and comprises 25 to 30% of leukemias in the United States.
A wide variety of genomic variations are associated with CLL, ranging from single nucleotide variants (SNVs) and insertions/deletions (indels) to complex chromosomal rearrangements such as copy number alterations (CNAs) of part or whole chromosome. Chromosomal abnormalities are very common in CLL, the most frequent being del(13q), trisomy 12, del(11q), del(17p) and del(6q).
Comprehensive genetic research into CLL requires multiple testing strategies with high associated costs. In this study, we tested the capability of OGT’s NGS panel, SureSeq™ CLL + CNV V3, to detect SNVs and indels as well as chromosomal aberrations in CLL research samples, allowing for the detection of CLL variants in a cost efficient and timely manner.
The SureSeq hybridization-based enrichment approach and OGT’s Universal Complete NGS Workflow Solution were used throughout this study (Figure 1).
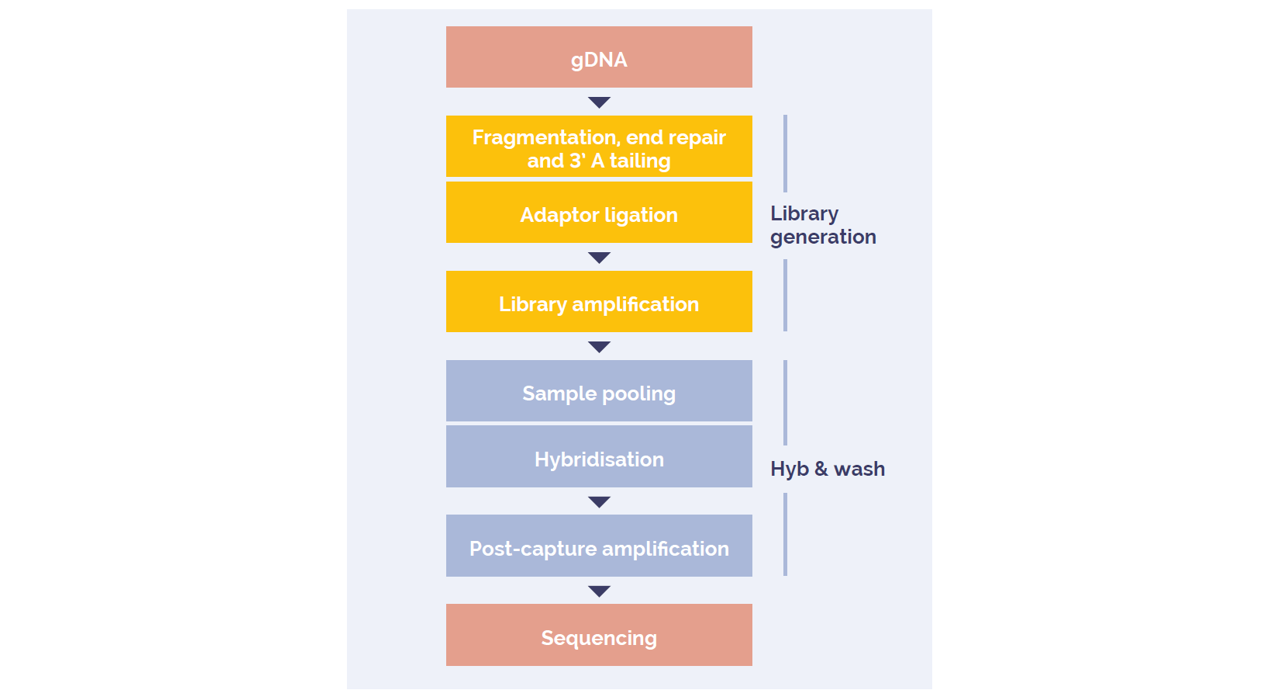
Figure 1: Universal NGS Workflow DNA to sequencer in 1.5 days with minimal handling time.
The SureSeq CLL + CNV V3 Panel can be used for detection of SNVs and indels in 16 genes and somatic CNAs in 5 critical regions.
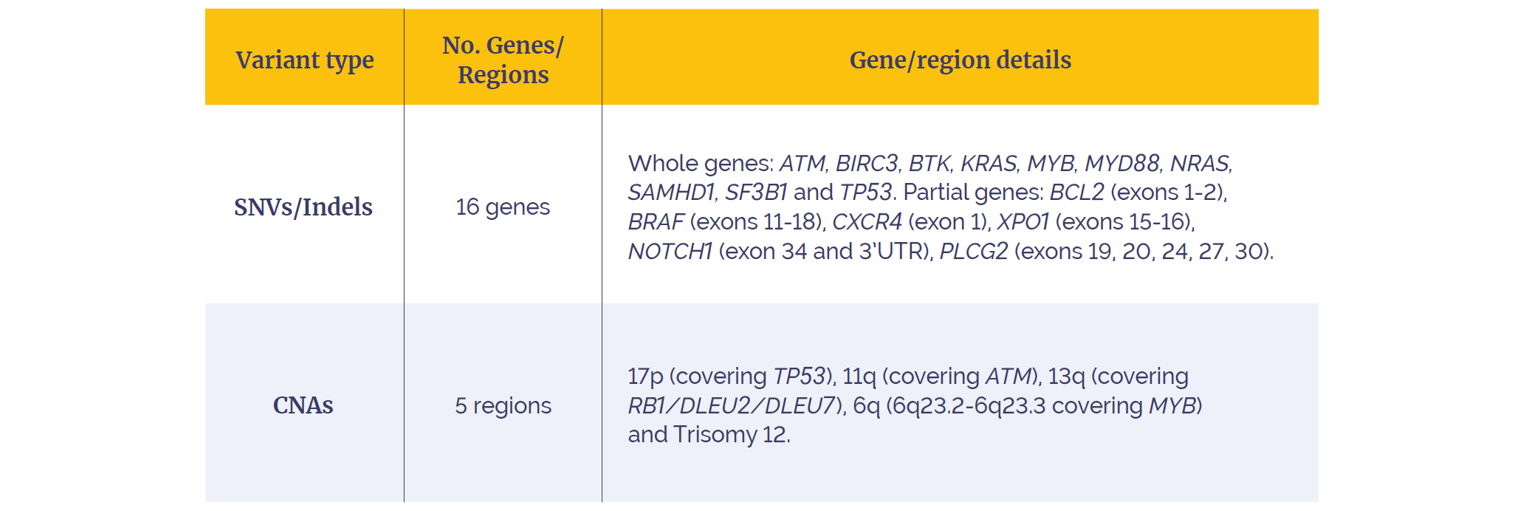
Table 1: SureSeq CLL + CNV V3 Panel content.
For each set of 8 samples, one Reference DNA (negative for aberrations in the critical regions) was hybridized and sequenced with the research samples. Information from reference DNA samples are used in the analysis for CNAs detection.
Sequencing was conducted using 2 x 150 bp reads on an Illumina MiSeq® V2 300.
The workflow and the panel were tested on reference DNA (Coriell Institute, Horizon) to validate the overall performance. CNAs capability was demonstrated by using 21 research samples with known CNAs in the regions of interest previously characterized by FISH.
To mimic CNAs at low tumor content, 11 research samples with known aberrations were diluted in order to create CNA carriers with 20-40% tumor content.
Sequencing data analysis including CNA detection was performed using OGT’s Interpret NGS Analysis Software.
High depth and uniform of coverage was achieved for all targeted genes and genomic regions allowing for confident detection of low frequency gene specific SNVs and indels.
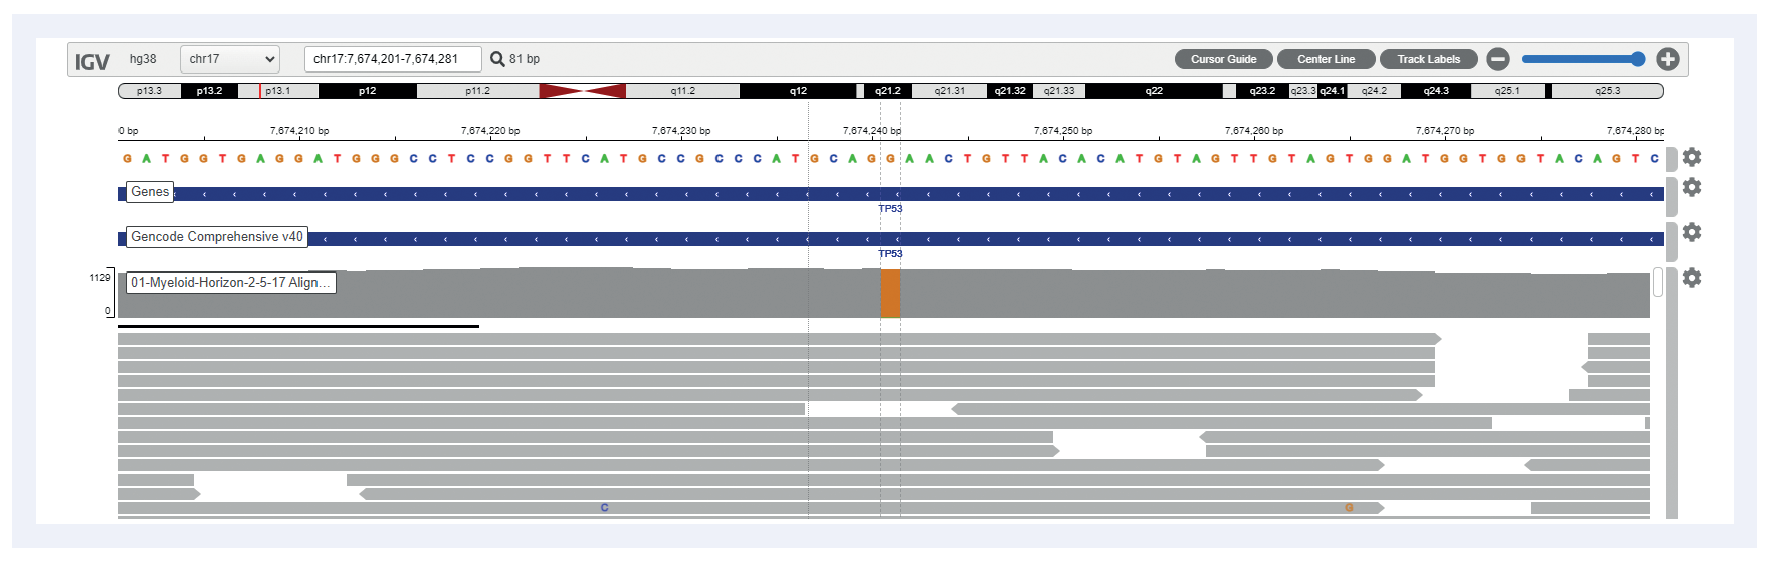
Figure 2: Example of TP53 c.722C>T estimated at 1.62% VAF.
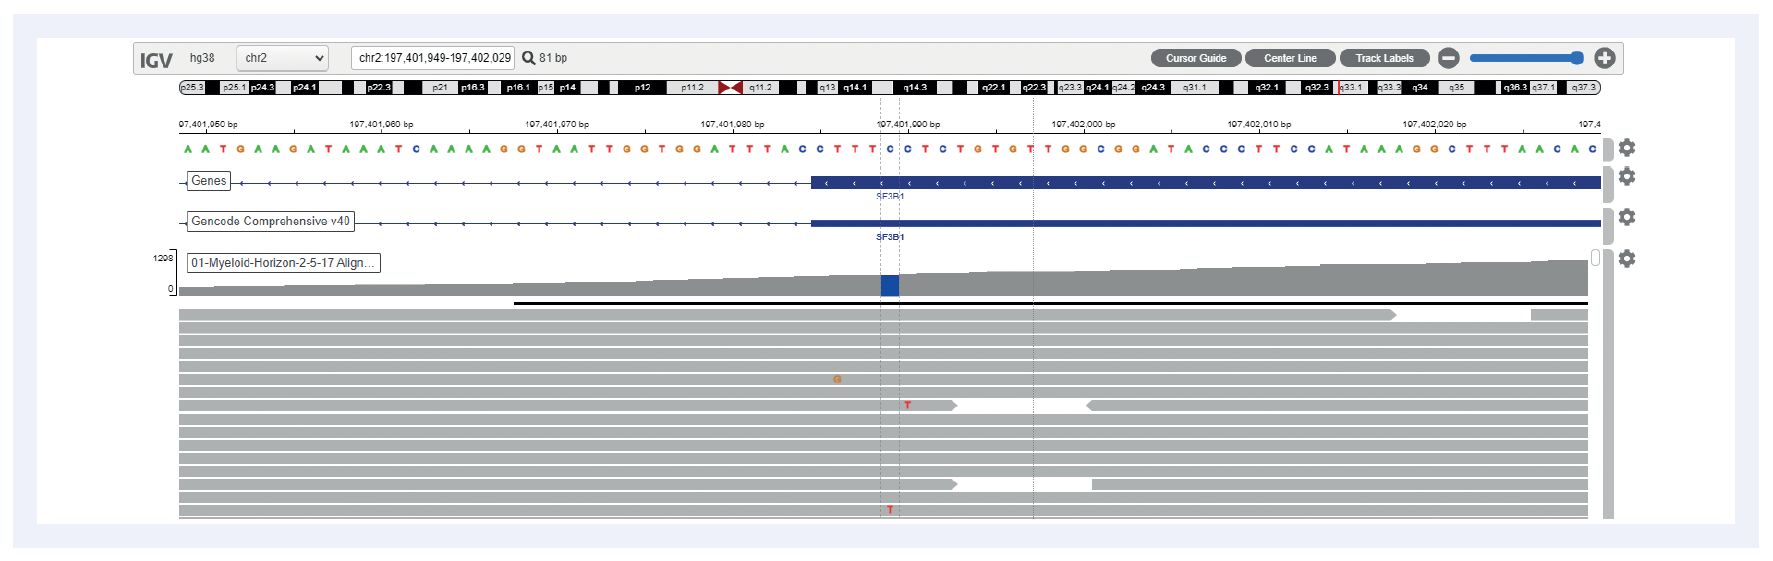
Figure 3: Example of SF3B1 c.2219G>A estimated at 1.04% VAF.
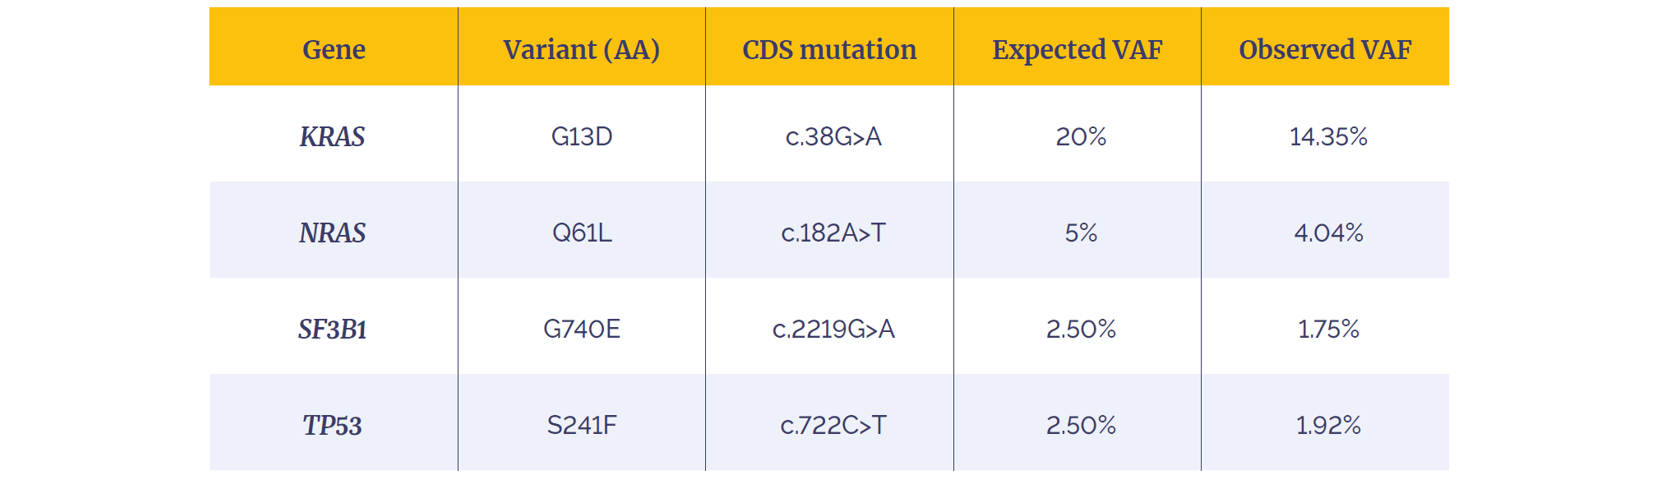
Table 2: Variants present in the Myeloid DNA Reference Standard (Horizon) and detected by the SureSeq CLL + CNV V3 Panel.
Data presented here are from 21 research samples that were processed using the OGT workflow in combination with OGT’s Interpret NGS Analysis Software.
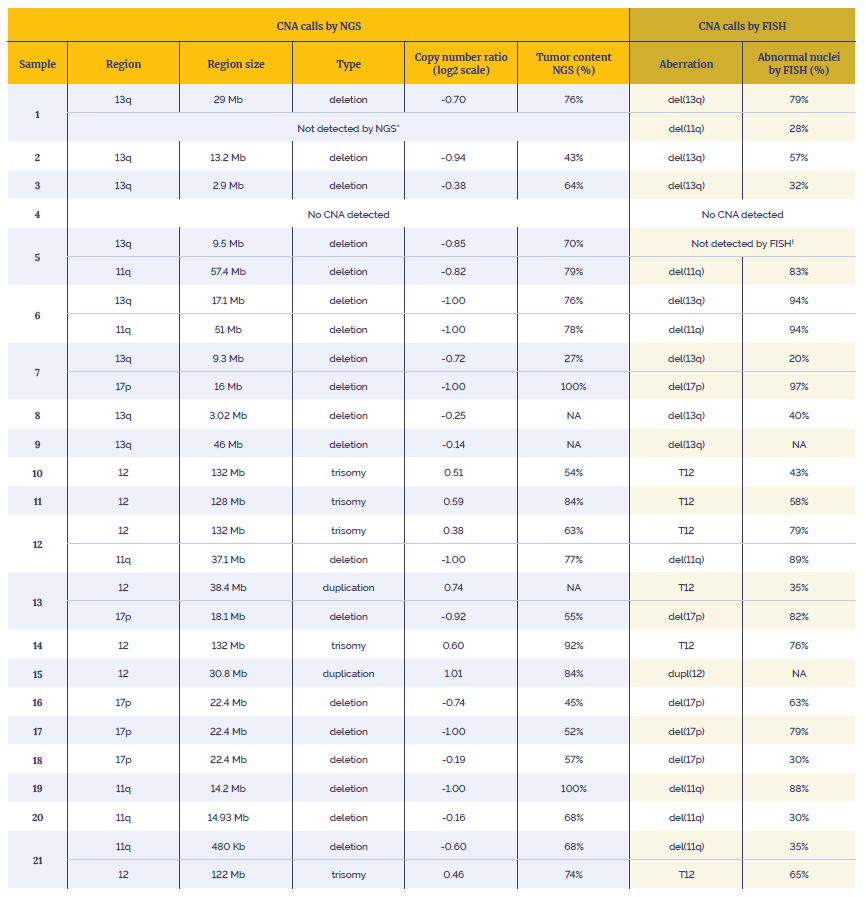
Table 3: Data generated using the SureSeq CLL + CNV V3 Panel in combination with the OGT’s Universal Complete NGS Workflow and OGT’s Interpret NGS Analysis Software.
*Not enough material to perform orthogonal tests. Suspected over-estimation of tumor content by FISH, likely to be below the level of detection of the assay (20%).
†Not enough material to perform orthogonal tests. Highly confident variant, log2 ratio=-0.85.
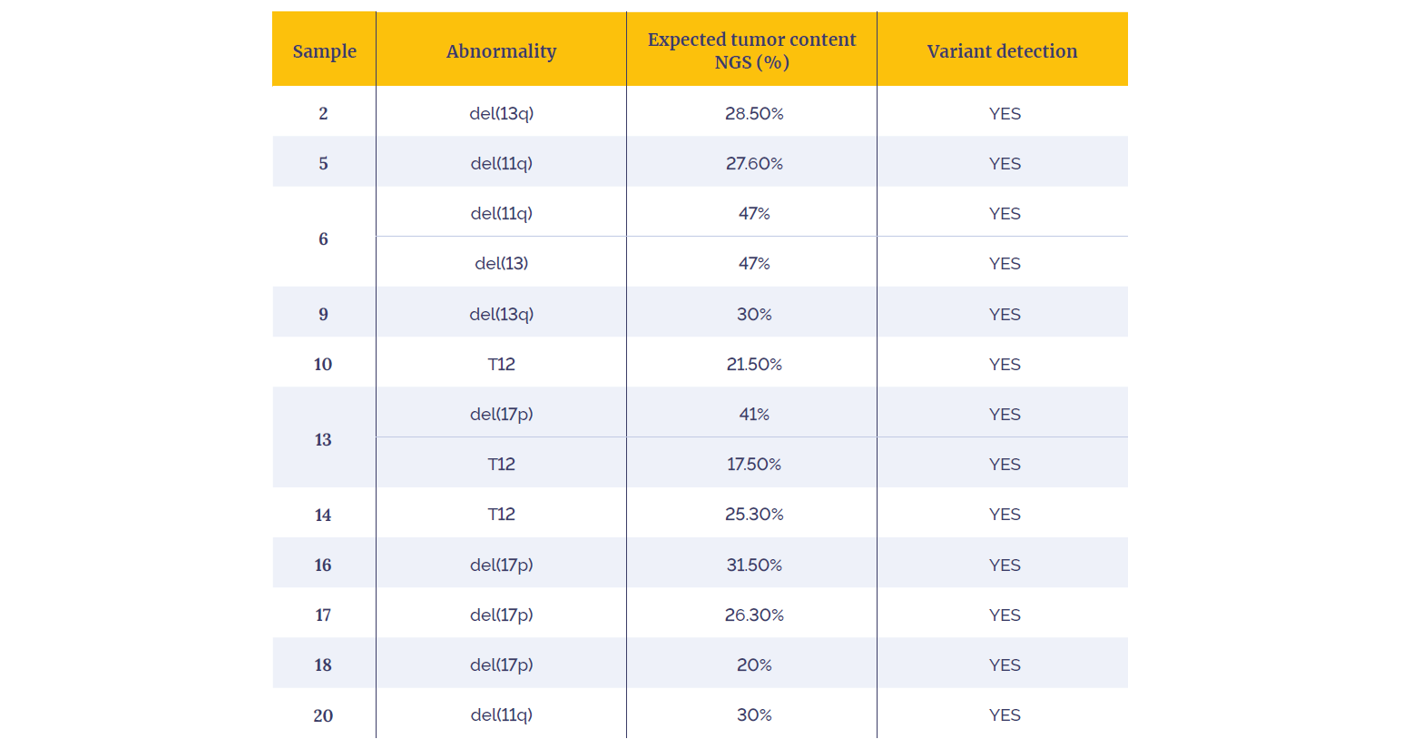
Table 4: Data generated diluting 11 research samples for low tumor content CNAs detection.
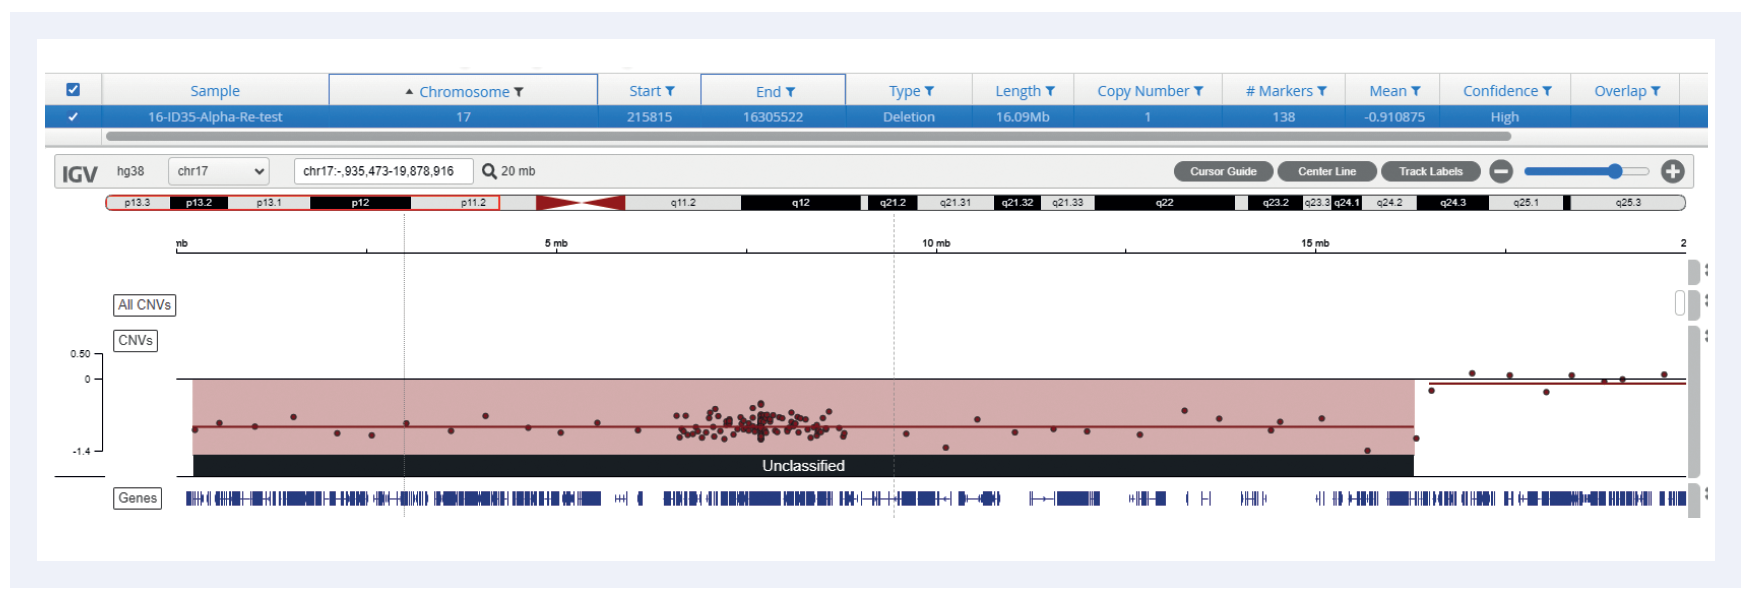
Figure 4: Example of a 16Mb deletion covering TP53 gene (del17p).
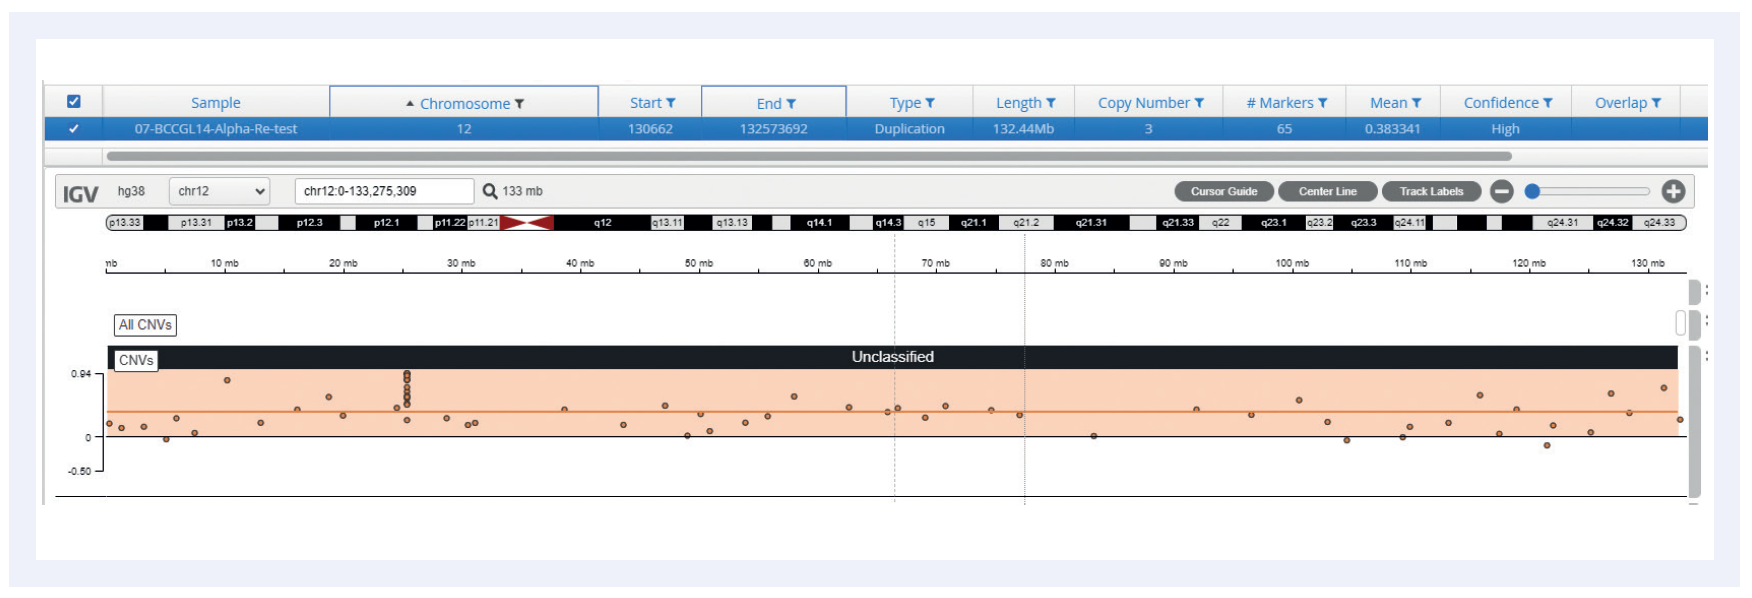
Figure 5: Example of a trisomy 12
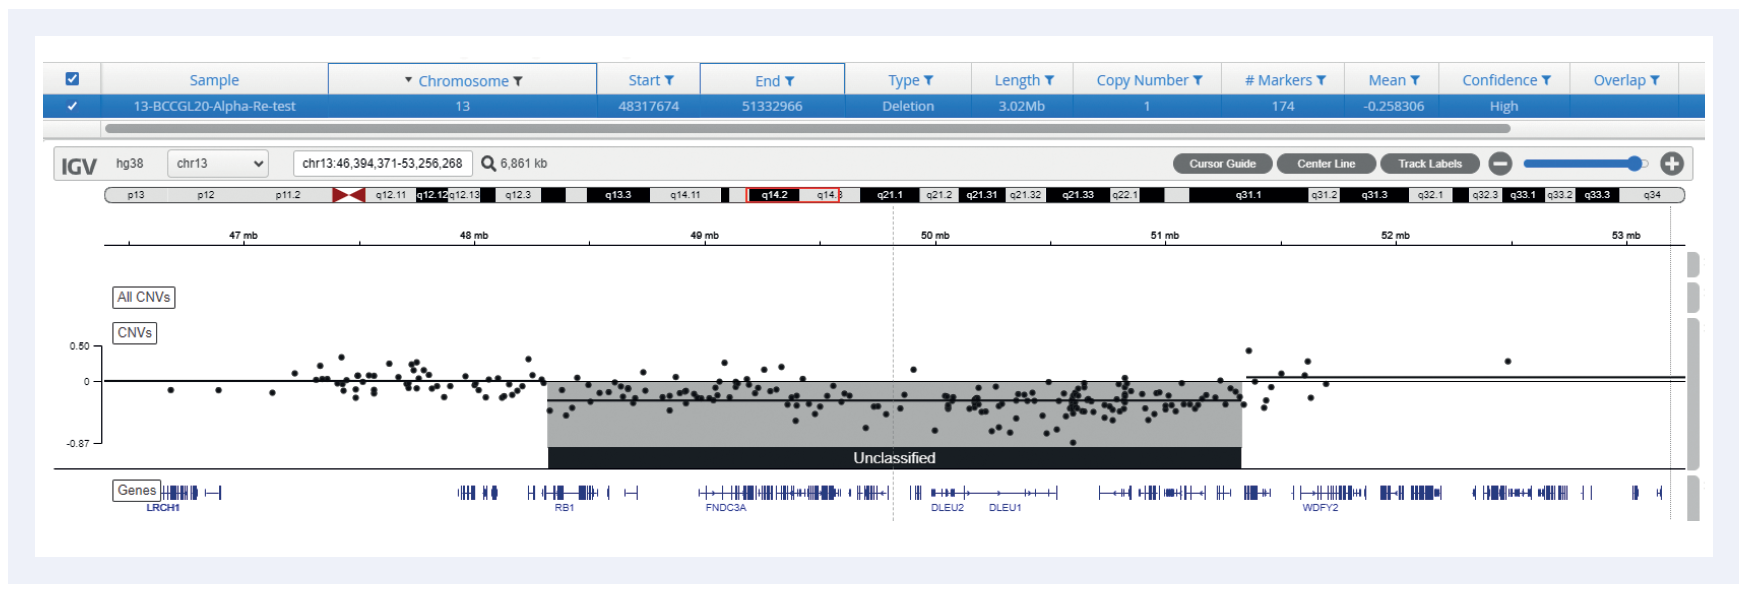
Figure 6: Example of a 3Mb deletion covering RB1 and DLEU1 genes (del13q).
SureSeq: For Research Use Only; Not for Diagnostic Procedures.
Call +44 (0)1865 856800 Email contact@ogt.com
Send us a message and we will get back to you
 Visit International site
 Visit Canada site